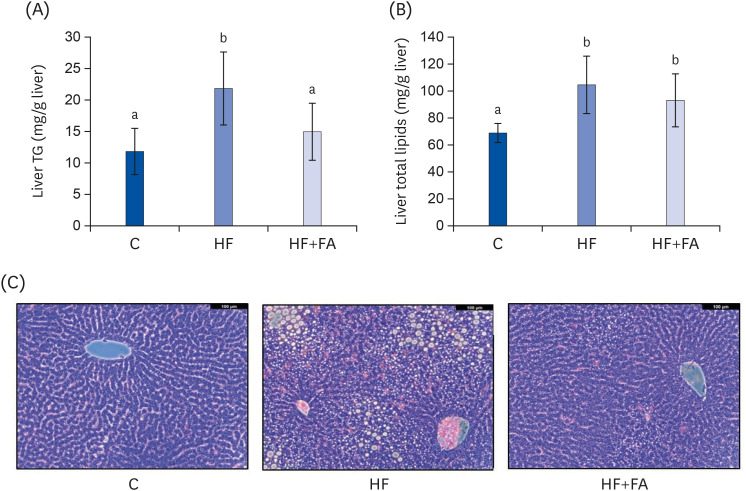
Fig. 4. Effects of folic acid supplementation on liver lipid accumulation in high-fructose-fed rats. (A) Liver TG (B) Liver total lipid content (C) Liver sections stained with H&E. Each bar presents the mean ± SD (n = 8). The images were captured using a Leica DMIL LED optical microscope (Leica, Wetzlar, Germany).
TG, triglyceride; H&E, hematoxylin and eosin; ANOVA, analysis of variance; C, control; HF, high-fructose diet; HF+FA, high-fructose diet with folic acid.
a,bDifferent letters mean significant difference according to ANOVA, Duncan's test (P < 0.05).

