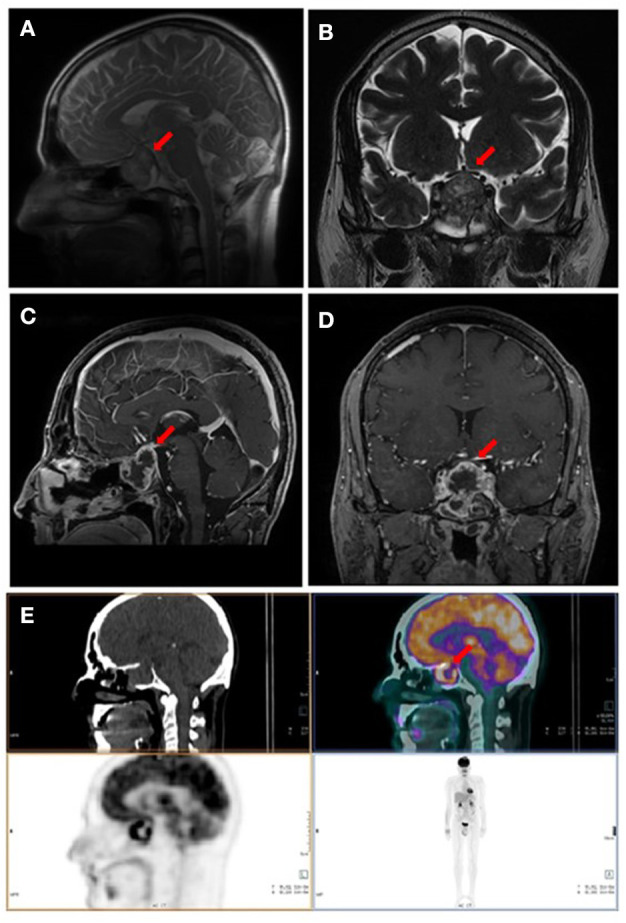
Figure 2.

Imaging performed 3 months after surgery. (A,B) Pituitary MRI, T2-weighted basal sagittal and coronal sequences. (C,D) Pituitary MRI, T1- weighted post-gadolinium sagittal and coronal sequences. (E) Whole body fluorine-18-fluorodeoxyglucose positron emission tomography/computed tomography (18F-FDG PET/CT) showing pathological uptake in sellar region. Red arrows indicate the sellar lesion.
