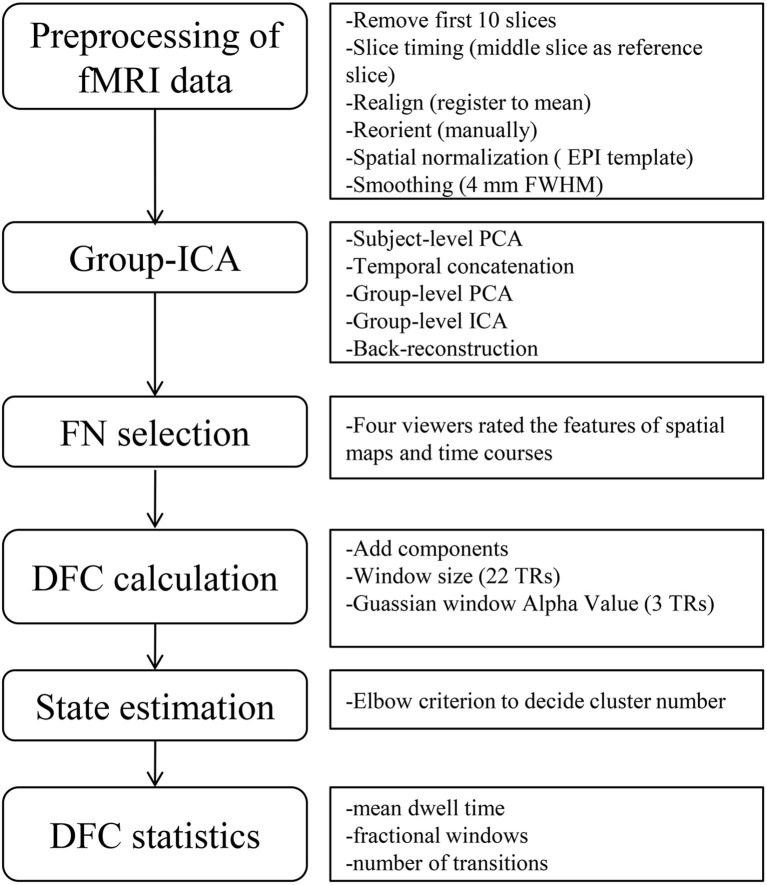
Figure 1.
Flow chart of data processing. The left part shows the overall steps of data processing, and the right part is the detailed sub-steps, including some important parameters in each step. ICA, independent component analysis; FN, functional networks; DFC, dynamic functional connectivity; FWHM, full width at half-maximum; PCA, principal component analysis; TRs, times of repetition.

