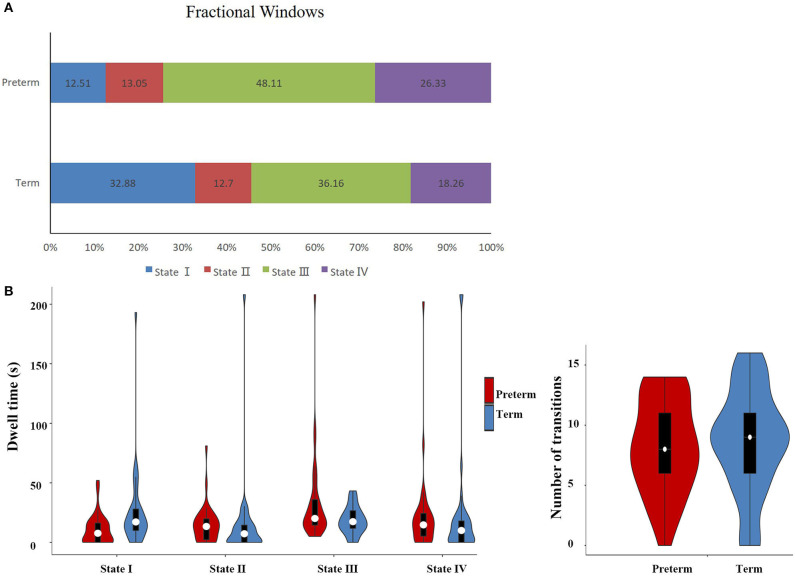
Figure 5.
Temporal properties of DFC states for the late preterm and term neonates. (A) Percentage of total time that all subjects spent in each state. (B) Mean dwell time and number of transitions between states were plotted using violin plots. The fractional windows and mean dwell time in State I and State III were significantly different between groups. It is worth noting that some infants in the late preterm group spent very long time in State III, while no one in the term group did.

