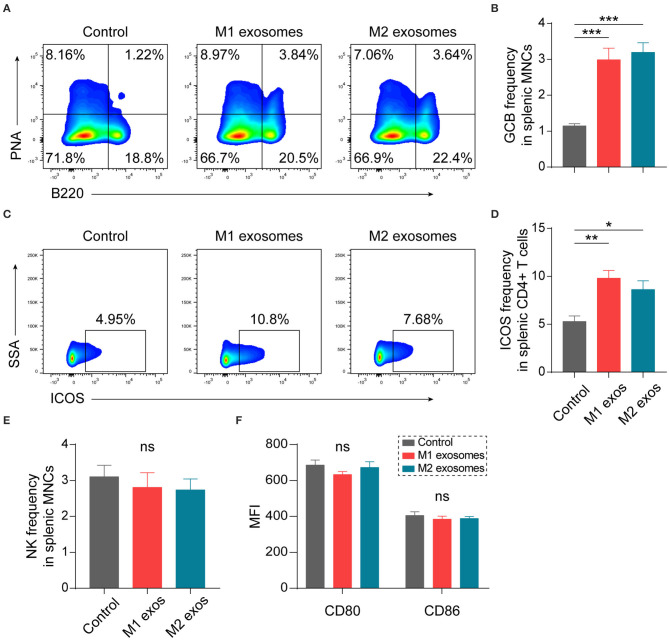
Figure 6.
Effects of M1 and M2 exosomes on germinal center reaction and innate immunity. Splenic MNCs from EAN rats were isolated and certain aspects of adaptive and innate immunity were detected by flow cytometry (n = 6 in each group). (A,B) Representative flow cytometry plots (A, gated on splenic MNCs) and summary data (B) illustrating the proportion of GCB cells (B220+PNA+) in splenic MNCs. (C,D) Representative flow cytometry plots (C, gated on CD4+ T cells) and summary data (D) illustrating the expression of ICOS in splenic CD4+ T cells. (E) Summary data illustrating the proportion of NK cells (CD3-CD161+) in splenic MNCs. (F) Summary data illustrating the expression of CD80 and CD86 on splenic macrophages (CD11b+). Data are expressed as mean ± SEM. *p < 0.05, **p < 0.01, ***p < 0.001, ns, not significant, calculated by calculated by one-way ANOVA followed by LSD test with normally distributed data (B,E,F) or by Kruskal-Wallis test followed by pairwise comparisons with not normally distributed data (D).

