Figure 7.
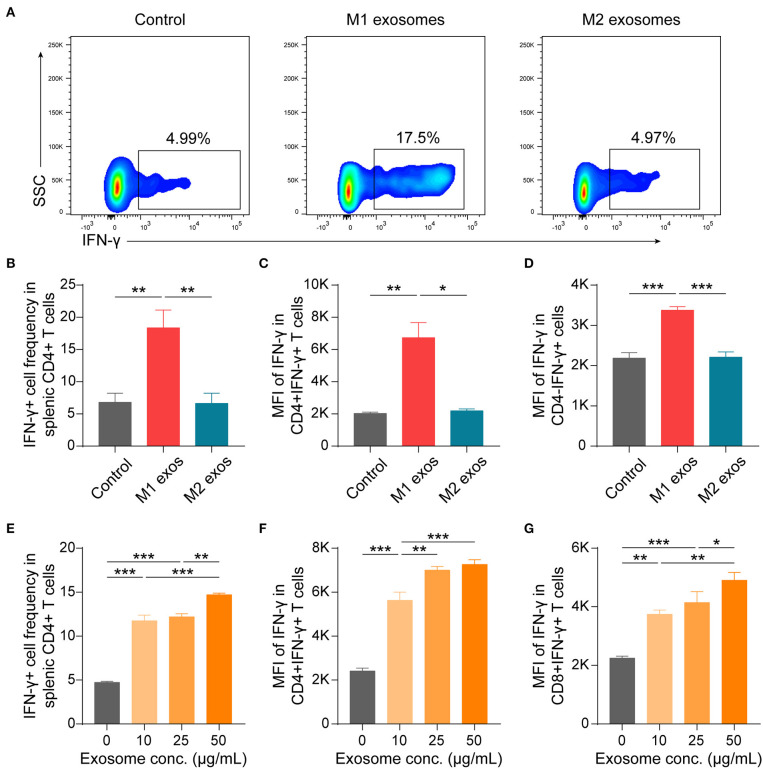
M1 exosomes promote IFN-γ expression in both CD4+ and CD8+ T cells, while M2 exosomes are not capable of inhibiting IFN-γ expression in vitro. Splenic MNCs were isolated and co-cultured with M1 or M2 exosomes for 48 h following pre-activation by α-CD3 (1 μg/mL) and α-CD28 (1 μg/mL) for 24 h, and were then detected for IFN-γ expression in CD4+ or CD8+ T cells by flow cytometry. (A,B) Representative flow cytometry plots (A, gated on CD4+ T cells) and summary data (B, n = 6 in each group) illustrating the proportion of IFN-γ+ cells in splenic CD4+ T cells after incubating splenic MNCs with macrophage exosomes (50 μg/mL). (C,D) Summary data (n = 6 in each group) illustrating the MFI of IFN-γ expression in CD4+ cells (C) and CD4- cells (D). (E–G) Summary data (n = 4 in each group) illustrating the proportion of IFN-γ+ cells in CD4+ T cells (E), and MFI of IFN-γ expression in CD4+ T cells (F) and in CD8+ T cells (G) after incubating splenic MNCs with M1 exosomes at indicated concentrations. Data are expressed as mean ± SEM. *p < 0.05, **p < 0.01, ***p < 0.001, calculated by one-way ANOVA followed by LSD test with normally distributed data (B,D–G) or by Kruskal-Wallis test followed by pairwise comparisons with not normally distributed data (C).

