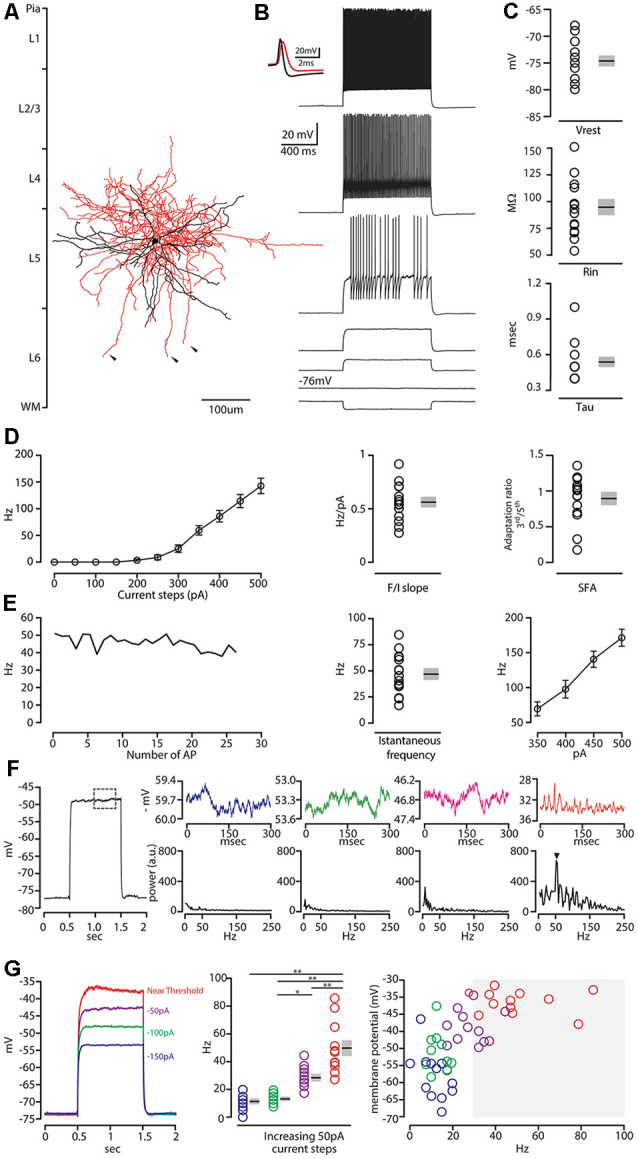
Figure 4.

Morphological and electrophysiological characterization of layer 5 CS-Parv neurons. (A) Morphological reconstruction of one CS-Parv neuron (dendrites, black; axons, red). (B) Train of action potentials recorded in a layer 5 GFP/tdTomato-positive CS-Parv neuron during step current injection (1.0 s, 100 pA pulse). Top left inset, single action potential from layer 5 GFP/tdTomato-positive CS-Parv neuron (black); compare to an action potential from a corticostriatal somatostatin-expressing GABAergic neuron (red). (C) Top: summary plot of Vrest: resting membrane potential; Middle: Ri: input resistance; Bottom: Tau: membrane time constant; from CS-Parv neurons (neurons n = 15, animals n = 8; including group average ± SEM). (D) Left: summary plot of averaging firing rate per current step amplitude recorded from layer 5 CS-Parv neurons (black circles, n = 15 neurons, animals n = 8), including group averages (± SEM). Middle: same as in panel (D) for F/I slope. Right: same as in panel (D), for spike frequency adaptation (SFA; f3rd/f5th). (E) Left: representative instantaneous frequency near-threshold as a function of the number of AP from layer 5 CS-Parv. Middle: summary plot of instantaneous frequency near-threshold from layer 5 CS-Parv neurons (black circles, n = 15 neurons, animals n = 8), including group averages (± SEM). Right: summary plot of instantaneous firing frequency in response to increasing depolarizing current (350–500 pA, 50 pA increments) for layer 5 CS-Parv neurons (black circles, n = 15 neurons, animals n = 8) including group averages (± SEM). (F) Left: example trace in response to depolarizing 1 s current. The dashed box represents the region analyzed in the left section of the panel. Top row: representative membrane potential oscillation at four increasing 50 pA increasing current steps to reach near-threshold membrane potential (blue trace: −150 pA; green trace: −100 pA; magenta trace: −50 pA of the near-threshold current; red trace: membrane potential near-threshold defined as 0 pA current injection from near-threshold). Bottom row: corresponding frequency contents of the four different membrane potentials. The arrow indicates the peak in the gamma range (52 Hz) of membrane oscillation at the near-threshold potential. (G) Left: representative membrane potential changes in response to 1 s long 50 pA increasing current steps (blue, green, and purple traces) to reach near-threshold (red trace). Middle: frequency content of membrane oscillation in response to increasing current steps, color code as in panel (G) (left, n = 12 neurons, including group average ± SEM, *p < 0.05; **p < 0.001). Right: membrane potential in response to increasing current steps [color code as in panel (G) (left as a function of the frequency content of membrane oscillation]. Gray box: gamma frequency range (30–100 Hz, n = 12 neurons).
