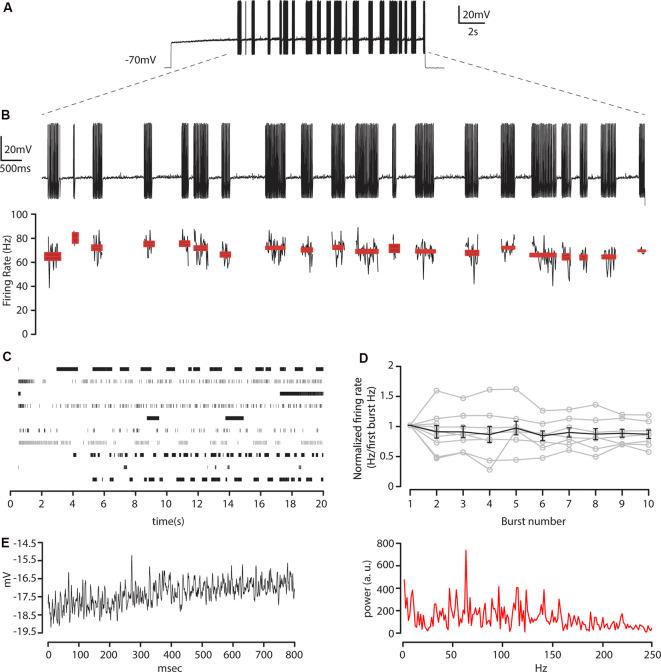
Figure 6.
Membrane resonance in response to near-threshold sustained current steps. (A) Train of action potentials recorded at −70 mV from layer 5 CS-Parv neurons in response to a step of depolarizing current pulse (20 s, pA = near-threshold). (B) Top: enlargement of bursts in (A). Bottom: instantaneous firing rate for each burst and spike count for each burst, including average ± SEM (C) Raster plot for each neuron recorded in response to steps of depolarizing current pulses near-threshold (n = 10 neurons). (D) The average plot of firing rate for the first 10 bursts normalized to the average firing rate of the first burst of action potentials (gray traces: n = 11 neurons), including average ± SEM (black trace). (E) Left: an example of a membrane potential trajectory between bursts of action potentials. Right: corresponding frequency spectrum of the near-threshold oscillations during the pause. The peak of the spectrum corresponds to the gamma-band frequency (63.2 Hz).

