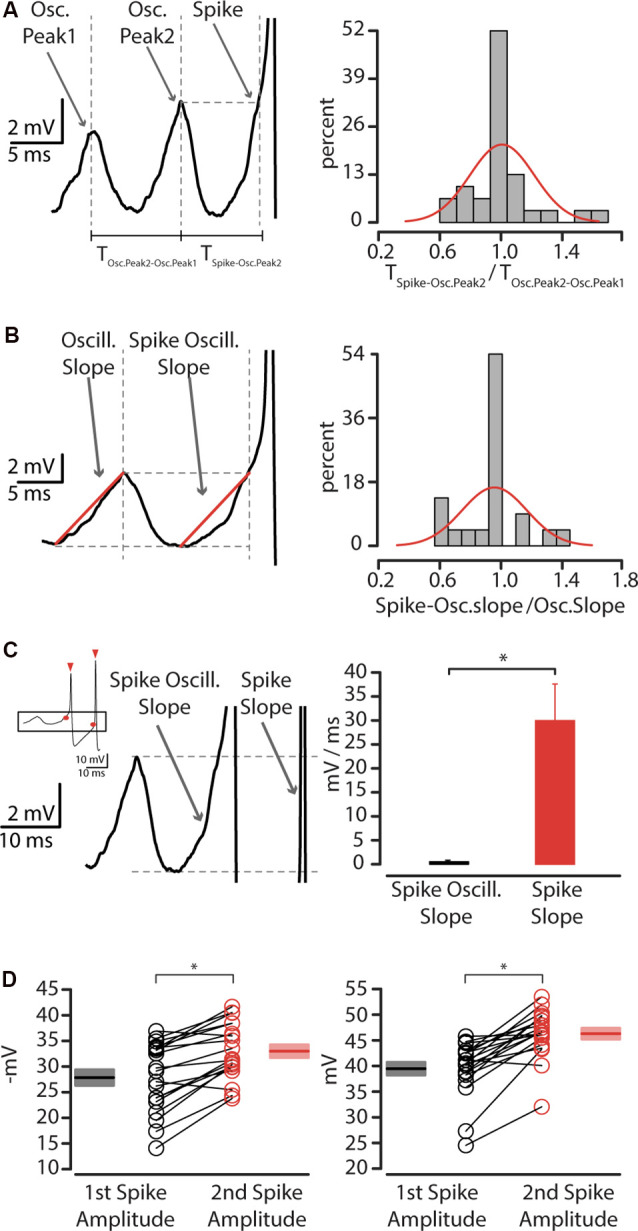
Figure 7.

The relation between membrane oscillations and action potentials. (A) Left: the interpeak interval between oscillations preceding action potential. Right: quantification of the ratio between the interpeak interval of the last oscillation peak and spike, and the interpeak interval between second to last and last oscillation peak before an action potential, showing unitary distribution (mu = 1.007, sigma = 0.210). (B) Left: oscillation slope and spike-oscillation slope before first action potential. Right: quantification of the ratio between spike-oscillation slope and oscillation slope, showing unitary distribution (mu = 0.953, sigma = 0.213). (C) Left: spike-oscillation slope compared to spike slope. The inset shows a representative trace of action potentials thresholds (red circle) and amplitude (red triangles) Right: summary plot of the spike-oscillation slope, expressed in mV/ms ± SEM, *p < 0.05. (D) Left: plot of first (n = 35, black circles) and second (n = 35, red circles) AP threshold recorded from layer 5 CS-Parv neurons, including group average (±SEM, *p < 0.05). Right: Plot of first (n = 35, black circles) and second (n = 35, red circles) AP amplitude recorded from layer 5 CS-Parv neurons, including group average (±SEM, *p < 0.05).
