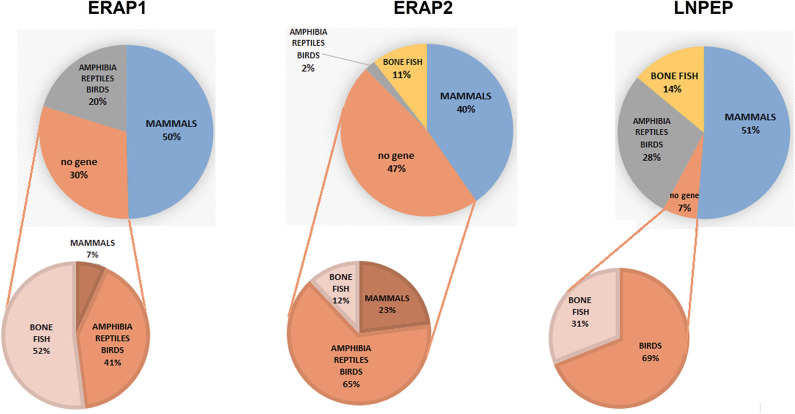
Figure 1.
Pie charts summarizing the expression of the orthologous genes ERAP1, ERAP2 and LNPEP along the animal classes as reported by the NCBI's Gene resource (https://www.ncbi.nlm.nih.gov/search/all/?term=orthologs). Amphibians, reptiles, and birds have been merged due to the small number of available species analyzed. The composition of the negative fraction for each gene is shown in the pie charts at the bottom.

