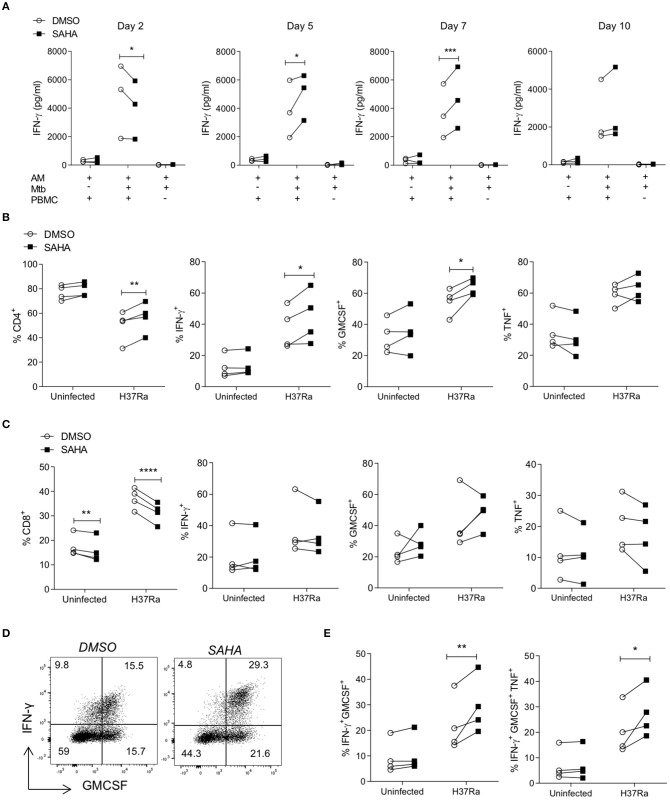
Figure 4.
SAHA treated AM enhanced BCG-primed CD4 Th cell responses to Mtb infection. Human AM were infected with H37Ra (MOI 1-10) in the presence of SAHA or DMSO. After 24 h, AM were washed and co-cultured with CFSE-labelled PBMC from a BCG-vaccinated healthy donor (IGRA negative) who responds to PPD antigens in vitro. Uninfected AM co-cultured with PBMC and Mtb-infected AM not co-cultured with PBMC were assayed in parallel as controls. (A) The concentrations of IFN-γ present in the supernatants on the indicated days were analysed by ELISA (n = 3). On day 10 post co-culture, PBMC were removed, stimulated with PMA/ionomycin in the presence of brefeldin A, or left unstimulated. (B,C) Cells were stained with fluorochrome-conjugated antibodies specific for CD3, CD4, CD8, IFN-γ, TNF and GM-CSF, and analysed by flow cytometry. Cells were gated on the basis of forward and side scatter, doublets were then excluded and the population of proliferating CFSElo cells were gated. The CD4 and CD8 cell subpopulations were gated within proliferating cells, then cytokines were examined within these populations. Graphs illustrated collated data (n = 4) from unstimulated samples for the frequencies of proliferating cells expressing CD4 (B; left) or CD8 (C; left) and cytokine production from stimulated samples within the population of proliferating (CFSElo) CD3+ CD8− (CD4+) T helper cells (B) and CD3+ CD8+ cytotoxic T cells (C). (D) Representative dot plots illustrate co-staining of IFN-γ and GM-CSF within the CFSElo CD3+ CD8− Th cell gate. (E) Collated data shows the frequencies of IFN-γ+ GM-CSF+ double-positive and IFN-γ+ GM-CSF+ TNF+ triple-positive cells in the CD4 Th cell population that are proliferating. Statistically significant differences between DSMO and SAHA treated groups were determined by two-way ANOVA with Sidak's multiple comparisons test; *P < 0.05, **P < 0.01, ***P < 0.001, ****P < 0.0001.

