
Figure EV2. Time‐dependent ACE2 expression changes induced by fluphenazine and vemurafenib from the CMAP dataset.
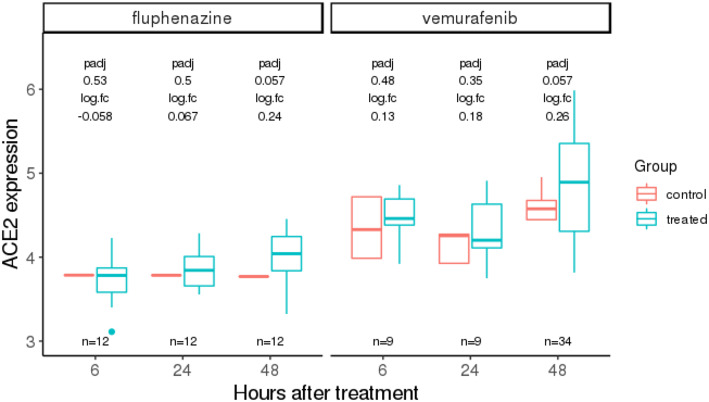
Fluphenazine and vemurafenib represent the drugs that significantly modulate ACE2 expression at the 48‐h time point, and for which data are also available at 6‐ and 24‐h time points. The adjusted P values (padj) computed using limma (Ritchie et al, 2015) and log fold changes (logFC) in treated vs control ACE2 expressions are labeled above the box plots. We observe a time‐dependent increase in the extent of ACE2 upregulation in treated vs control for both of these drugs. The three x‐axis values (6, 24, and 48) are placed equidistant not on a linear scale. Here, the center line, box edges, and whiskers in the box plots denote the median, interquartile range, and the rest of the distribution in respective order, except for points that were determined to be outliers using a method that is a function of the interquartile range, as in standard box plots.