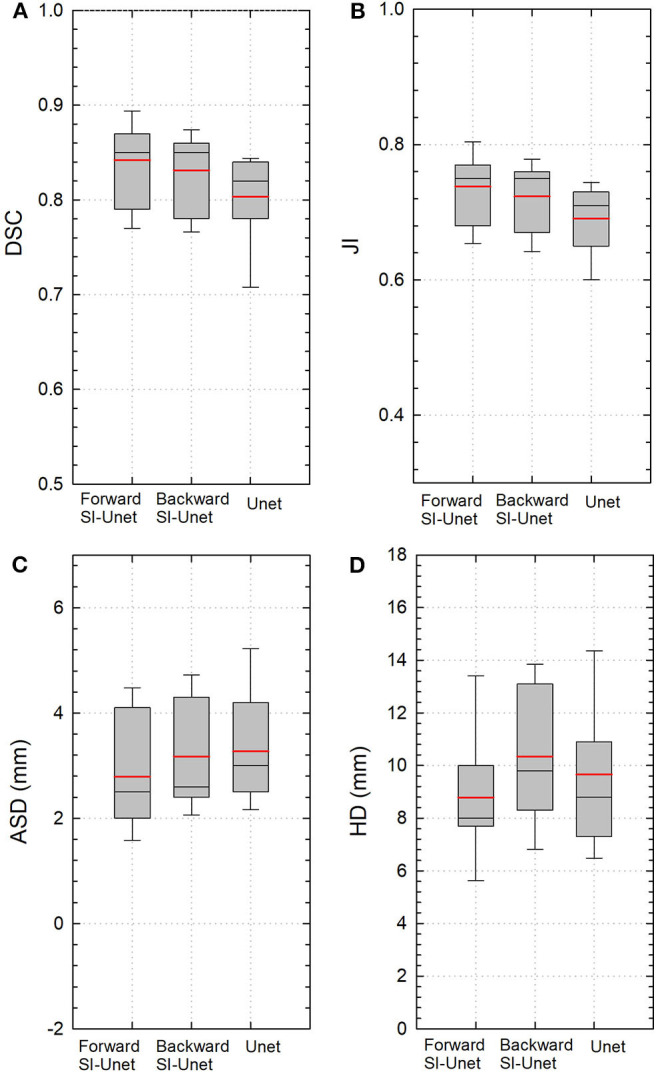
Figure 2.

Boxplots of (A) DSC, (B) JI, (C) ASD, and (D) HD values from three different models. Red and black lines represent the mean and median values, respectively. The boxes indicate the 25th and 75th percentiles; the error bars indicate the 10th and 90th percentiles. DSC, Dice similarity coefficient; JI, Jaccard index; ASD, average surface distance; HD, Hausdorff distance.
