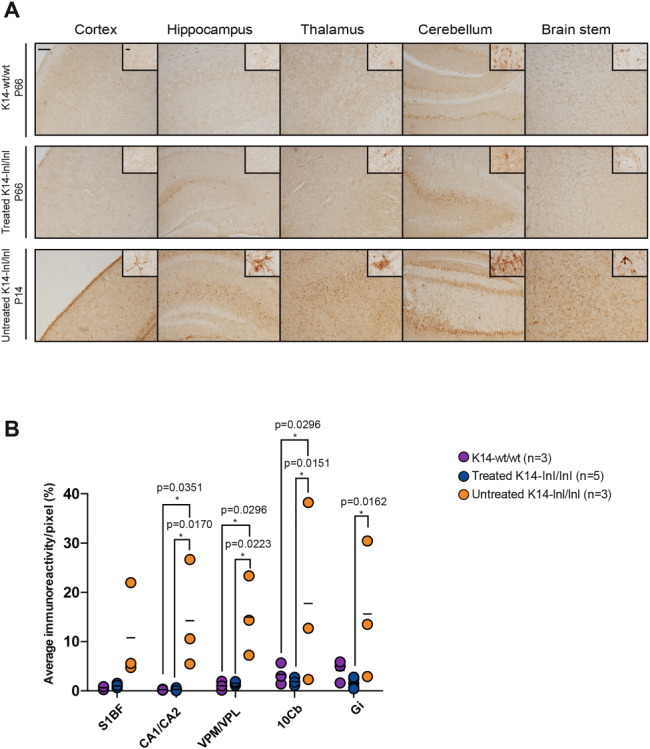
Figure 6.

Normalization of lysosome accumulation following gene therapy administration. (A) Brain section images and (B) quantification of the staining for the lysosomal marker LAMP1. Treated brains showed significant reduction in lysosome accumulation in several brain regions. Cortex (S1BF), hippocampus (CA1/CA2), thalamus (VPM/VPL), cerebellum (10Cb) and brain stem (Gi). Scale bars: low magnification 100 μm; high magnification 60 μm.
