
Figure 6.
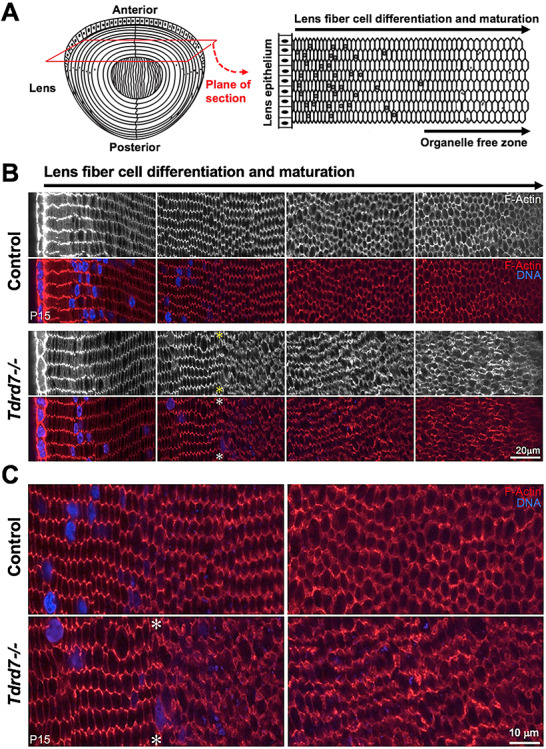
Phalloidin staining for F-actin demonstrates abnormal cellular morphology specifically in fiber cells after nuclear degradation in Tdrd7−/− lenses. (A) Diagram of a lens (left) with the cross-sectional plane (red) through the lens equator. Schematic of the resulting lens equatorial cross section (right) wherein epithelial cells are located at the periphery and hexagonal morphology of fiber cells is visualized. Early to late maturation stages of differentiating fiber cells are indicated, along with the organelle-free zone. (B) Control and Tdrd7−/− lens sections at P15 were stained with phalloidin to visualize F-actin. DNA was visualized by Hoechst stain. Images from comparable areas representative of early to late fiber differentiation and maturation (left to right) are shown for control and Tdrd7−/− lenses. There is no discernable difference in young differentiating and maturing lens fiber cells (left-most panel and left-half of the second panel) between control and Tdrd7−/− lenses. However, coinciding with nuclear degradation (asterisk), fiber cells in Tdrd7−/− lens showed abnormal F-actin distribution, indicative of abnormal fiber cell morphology as compared to control (second panel). (C) Zoom-in of middle image panels shows abnormal fiber cell morphology and F-actin distribution coinciding with nuclear degradation (asterisk) and beyond in Tdrd7−/− lens.