Figure 1.

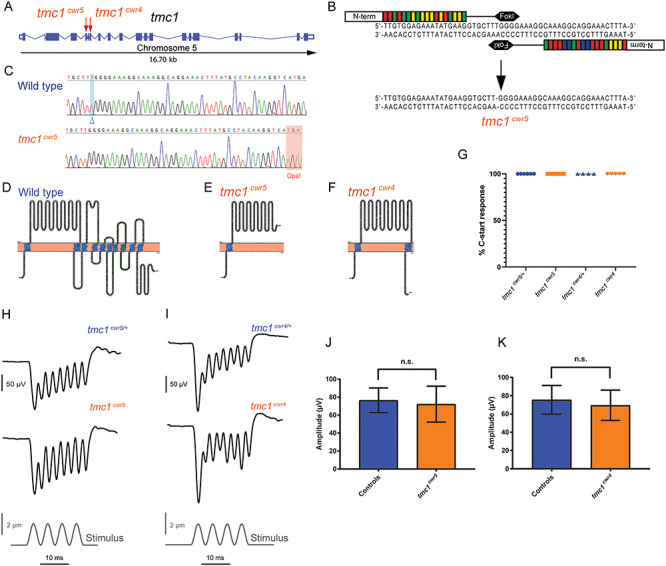
Mutation of tmc1 and behavioral and electrophysiological evaluation of mutants. (A) Schematic diagram illustrating the tmc1 genomic locus in zebrafish with exons and splice sites displayed. Red arrows mark the targeted exons, 5 and 7, and associated mutagenized alleles, tmc1cwr5 and tmc1cwr4, which were generated via TALEN or CRISPR, respectively. (B) Segment of exon 5 subjected to TALEN-mediated genome editing. Two recombinant TALENs associated with corresponding half-sites to enable FokI dimerization and DNA cleavage. Genomic editing deleted one nucleotide yielding a frameshift mutation. This mutant allele is termed tmc1cwr5. (C) Sequencing results of mutagenized and control loci. Blue highlight and blue delta indicate deleted nucleotide absent in the mutant. Red highlight denotes the opal mutation that was generated by TALEN targeting in tmc1cwr5. Topographical representations of wild-type Tmc1 protein (D) and mutated forms associated with alleles tmc1cwr5 (E) and tmc1cwr4 (F). Amino acids of putative transmembrane domains are labeled in blue, and the TMC domain is in green. (G) Graph of the mean percentages of mutant and control zebrafish that exhibited a C-start response when presented with vibrational stimuli ± standard error of the mean (SEM). Each data point represents the percentage of positive responses a larva had in a trial of 20 stimuli (ntmc1cwr5/+ = 6, ntmc1cwr5 = 9, ntmc1cwr4/+ = 4, ntmc1cwr4 = 5). Stimulus-evoked microphonic potentials measured from the otic vesicles of tmc1cwr5 (H), tmc1cwr4 (I) and control animals. Graphs of mean microphonic potentials from otic vesicles of tmc1cwr5 (J), tmc1cwr4 (K) and control animals. Mean potential of tmc1cwr5 ± SEM = 72 ± 7.1 μV (n = 8), mean potential of heterozygous siblings = 76 ± 4.8 μV (n = 8) (P = 0.3823); mean potential of tmc1cwr4 ± SEM = 69 ± 7.4 μV (n = 5), mean potential of wild-type or heterozygous siblings = 75 ± 6.4 μV (n = 6) (P = 0.9307). Statistical significance determined by Mann–Whitney test.
