Figure 4.

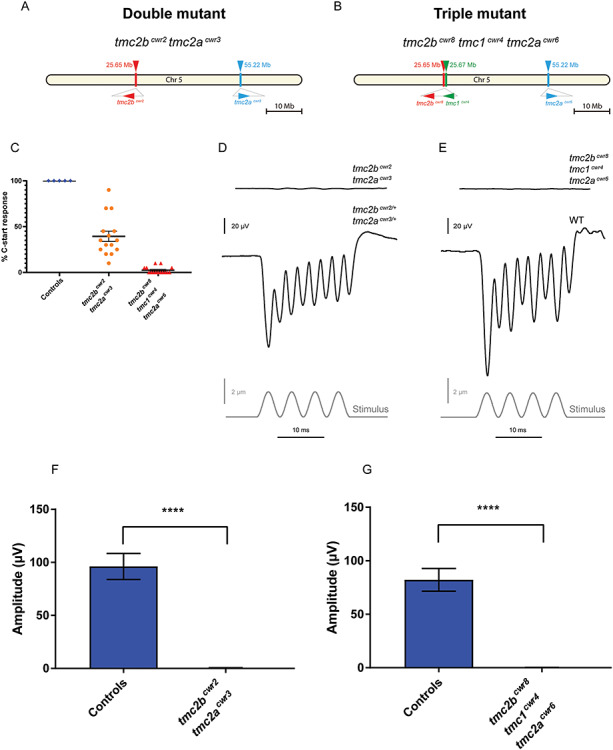
Behavioral and hair cell electrophysiological characteristics of tmc2bcwr2 tmc2acwr3 double and tmc2bcwr8 tmc1cwr4 tmc2acwr6 triple mutants. Schematics of chromosome 5 with relative positions of tmc genes and associated mutant alleles for the tmc2bcwr2 tmc2acwr3 double mutant (A) and the tmc2bcwr8 tmc1cwr4 tmc2acwr6 triple mutant (B). (C) Graph of the mean percentages of mutant and control zebrafish that exhibited a C-start response when presented with vibrational stimuli ± SEM. Each data point represents the percentage of positive responses a larva had in a trial of 20 stimuli (ntmc2bcwr2/+tmc2acwr3/+ = 5 (controls), ntmc2bcwr2tmc2acwr3 = 15, ntmc2bcwr8tmc1cwr4tmc2acwr6 = 15). Tmc2bcwr2 tmc2acwr3 double mutant = 39 ± 5.6%, tmc2bcwr8 tmc1cwr4 tmc2acwr6 triple mutant = 2.0 ± 0.96%. Representative recordings of microphonic potentials measured from the ears of (D) double- and (E) triple-mutant animals. (F, G) Graphs of mean microphonic potentials from otocysts of 7–10 dpf larvae are displayed. (F) Mean potential of tmc2bcwr2 tmc2acwr3 double mutants ± SEM = 0.42 ± 0.07 μV (n = 10), mean potential of heterozygotes (tmc2bcwr2/+ tmc2acwr3/+) = 96 ± 3.5 μV (n = 12). (G) No potentials were observed in tmc2bcwr8 tmc1cwr4 tmc2acwr6 triple mutants (n = 10), mean potential of wild-type controls = 82 ± 3.4 μV (n = 10). Mann–Whitney test, ****P < 0.0001.
