Figure 7.

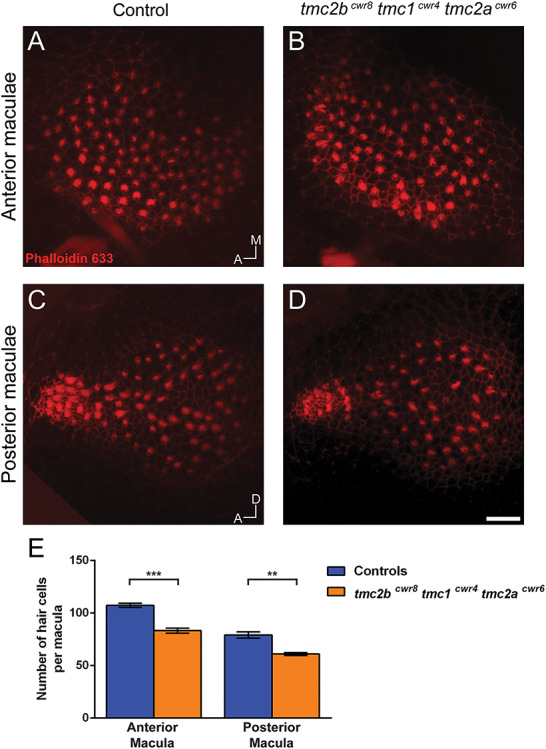
Quantitation of hair cell numbers in tmc2bcwr8 tmc1cwr4 tmc2acwr6 triple-mutant larvae. Confocal micrographs of anterior (A, B) and posterior (C, D) maculae from a tmc2bcwr8 tmc1cwr4 tmc2acwr6 triple mutant and a control (tmc2bcwr8/+ tmc1cwr4/+ tmc2acwr6/+) labeled with phalloidin 633. (E) Graph of enumerated cells of 8-dpf larvae. Mean ± SEM per anterior macula: 107 ± 2.0 (n = 3) for the control and 83 ± 2.4 (n = 4) for the triple mutant. Two-tailed unpaired t-test, ***P = 0.0008. Mean ± SEM per posterior macula: 79 ± 3.0 (n = 3) for the control and 61 ± 1.3 (n = 4) for the triple mutant. **P = 0.0017. A, anterior; M, medial; D, dorsal. Scale bar = 10 μm.
