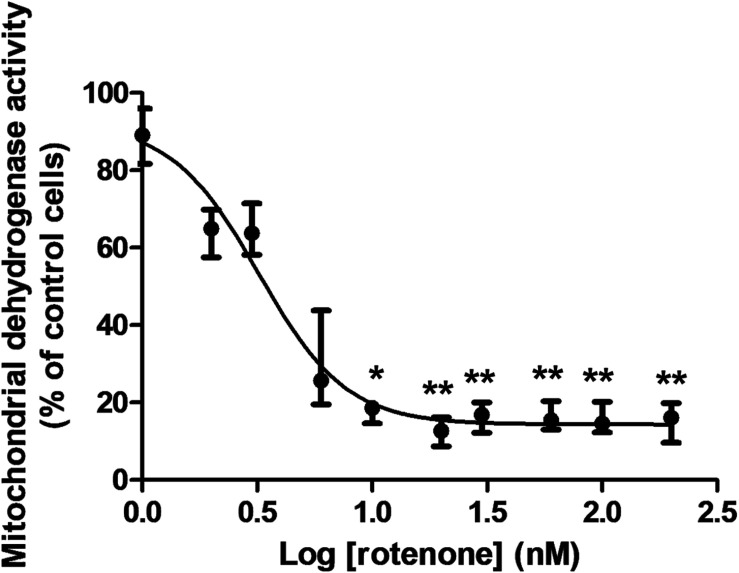
FIGURE 3.
Cytotoxic effect of rotenone to rat glioma C6 cells after 48 h measured by the MTT assay. The graph represents the experiment corresponding to the median EC50, which was 3.5 nM. Since the data did not follow a normal distribution, they were represented by medians and ranges. Cell viability corresponds to the mitochondrial dehydrogenase activity measured at 595 nm. Data were normalized to the median absorbance of the control cells treated only with 0.5% DMSO (Median: 1.041; Range: 1.026–1.237; n = 8), which was considered a 100% cell viability. Data analyzed by the Kruskal–Wallis test showed a significant effect for rotenone concentration (p < 0.0001). Groups were compared by Dunn’s multiple comparison test (n = 8 for every concentration). Statistical significance: *p < 0.05; **p < 0.0001 compared to control cells.

