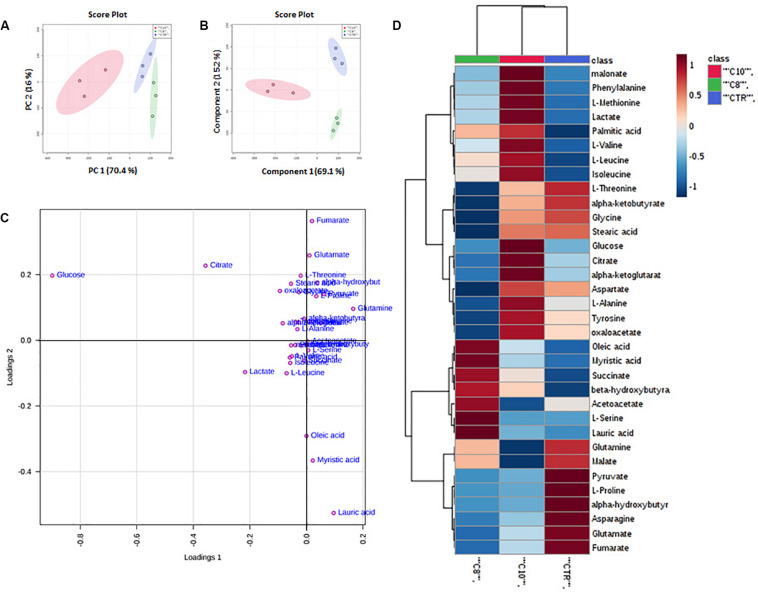
FIGURE 1.
Multivariate analysis of data from C8 or C10 treated U87MG cells. (A) Principal Component Analysis (PCA) of U87MG treated with C8 or C10 (N = 3). (B) Partial Least Squares Discriminant Analysis (PLS-DA) plot. The shaded areas indicate the 95% confidence ellipse regions based on the data points for individual groups. (C) Loading plot showing the most discriminative metabolites. (D) Heat map visualization based on 34 metabolites. Red: C10-treated cells; green: C8-treated cells; blue: CTR cells, respectively. The color key indicates metabolite values: dark blue: lowest; dark red: highest.

