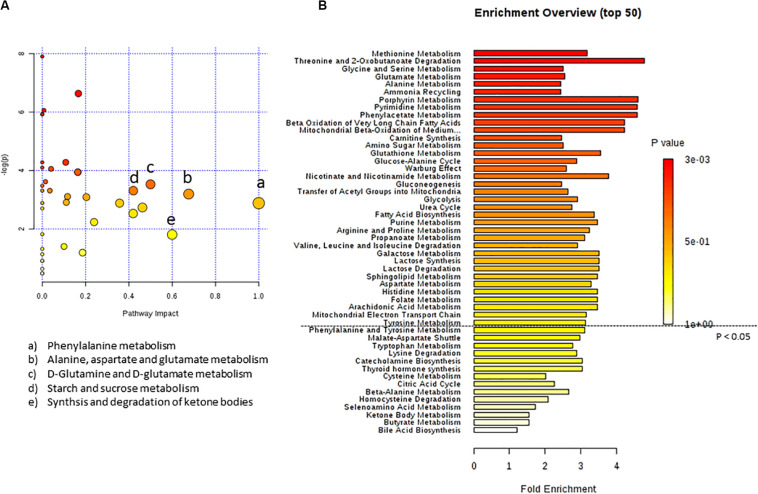
FIGURE 3.
Pathway analysis of metabolites in U87MG cells treated with C8 compared to CTR. (A) Metabolomics pathway analysis using the KEGG database. (B) Summary plot for metabolite Enrichment Analysis performed on the U87MG cells treated with C8 vs CTR cells, where metabolite sets are ranked according to the Holm p-value. The horizontal bar graph summarizes metabolic pathways that were significantly different between CTR and C8-treated cells.

