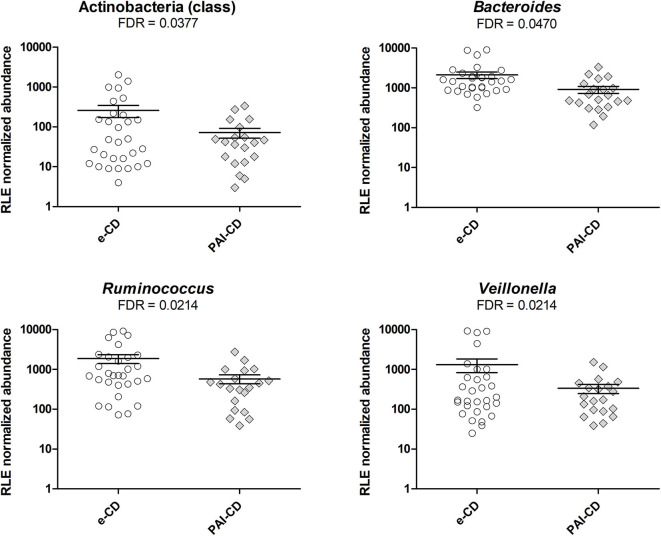
Figure 1.
Differential taxa in fecal microbiota of PAI-CD vs. e-CD patients. Scatter plots show taxa with significantly differential abundance between the two groups, after edgeR analysis followed by FDR correction for multiple testing (alpha value = 0.05). Only taxa with abundance >0.5% in at least one group are shown. The FDR value obtained for each taxon is also reported.

