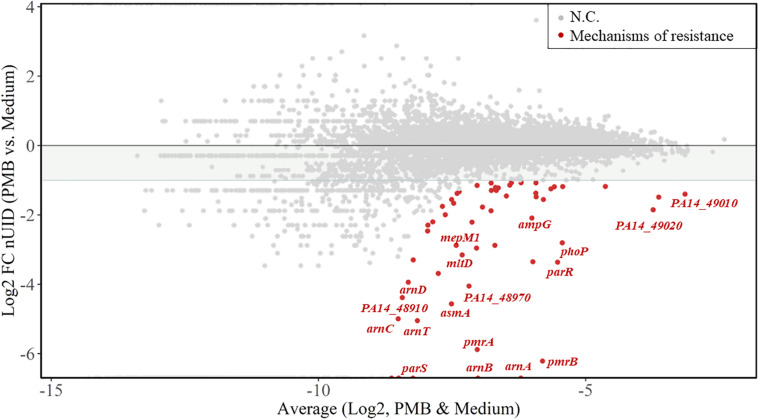
FIGURE 2.
Resistance fitness determinants for polymyxin B2 (PMB). The MA-plot (M for log ratio and A for mean average) shows the average of the normalized unique insertion density (nUID) between the PMB-treated sample and the untreated sample (log2) on the x-axis and the fold change of the nUID between the two samples (log2) on the y-axis. The 58 genetic determinants likely involved in bacterial fitness upon PMB exposure are highlighted in red and genes of interest are named. NC, no change.

