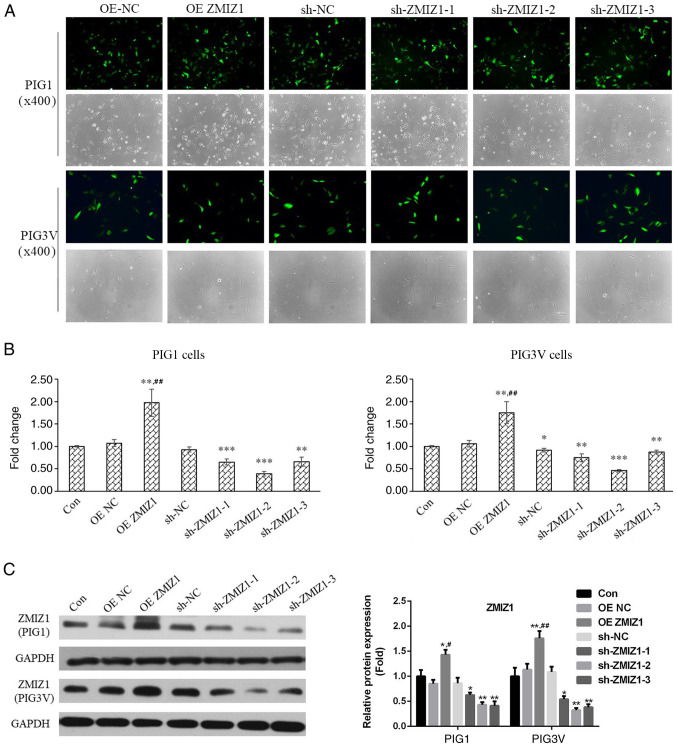
Figure 1.
Establishment of the ZMIZ1 knockdown and overexpression cell models. (A) Representative fluorescent images of the lentivirus-infected cells (magnification, x400). (B) mRNA expression levels of ZMIZ1 were analyzed in the different groups using reverse transcription-quantitative PCR. (C) Protein expression levels of ZMIZ1 were analyzed in the different groups using western blotting. *P<0.05, **P<0.01 and ***P<0.001 vs. Con. #P<0.05 and ##P<0.01 vs. OE NC. Con, control; ZMIZ1, zinc finger MIZ-type containing 1; OE, overexpression; NC, negative control; sh, short hairpin RNA.

