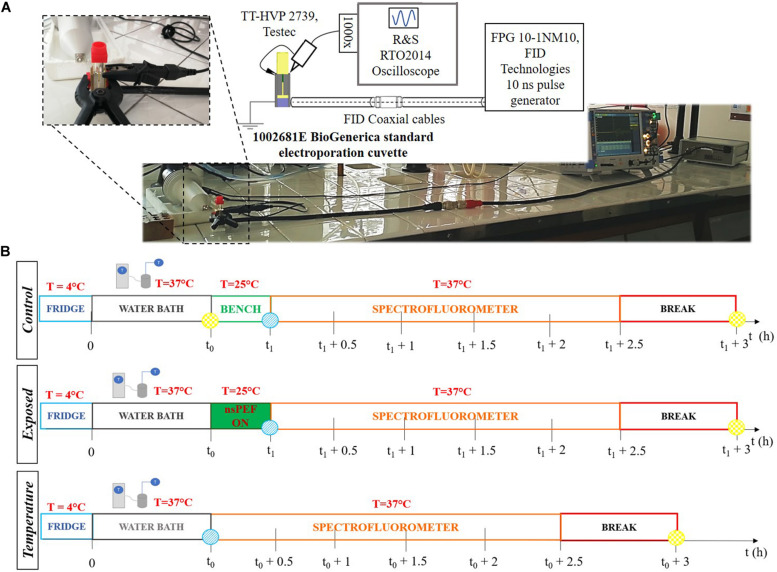
FIGURE 1.
(A) Exposure setup configuration and picture of the laboratory equipment used to perform the experiments. The generator is connected through two coaxial cables and a transition to the cuvette. The cuvette is filled with the liposomal suspension sample. The signal at the load is monitored in time with the R&S oscilloscope and two Testec HV probes. (B) Experimental protocol tuned to expose liposomal vesicles to a sequence of pulses, with a nanosecond duration and intensities in the order of MV/m. The three timelines represent the procedure performed for each sample. The t0 = 0.5 h is the thermal equilibration period, while t1 = (t0 + 0.28 h) is the start of the exposure. The times t0 and (t1 + 3 h) are, respectively, the reference time (blue point) and the maximum fluorescence time (yellow point) used to evaluate the electrical signal effect on the liposomes. The starting time for fluorescence analysis is t1.

