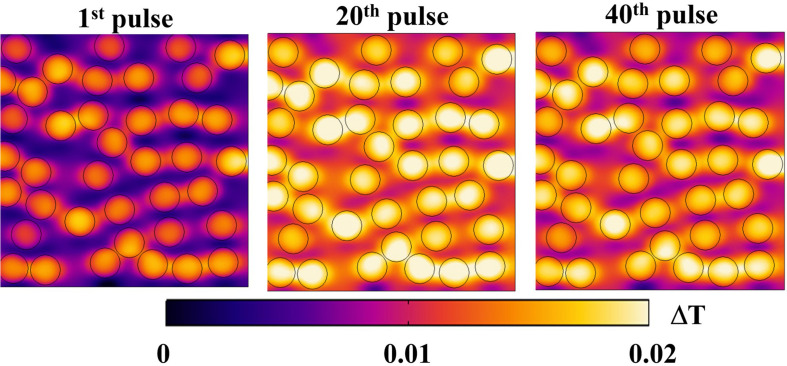
FIGURE 10.
Temperature distribution on a section of the simulation box at 10 ns for three different pulses: 1st, 20th, and 40th, respectively, in the left, central and right panels. The distribution reported as ΔT = T–Tmin for each pulse, changes during the exposure, maintaining the trend of higher values inside the vesicles and lower values outside.

