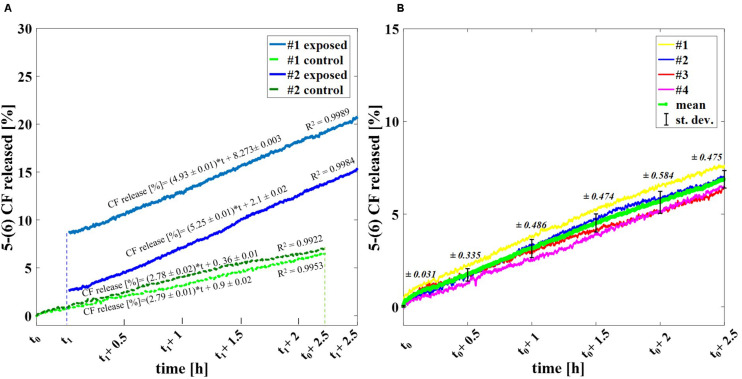
FIGURE 4.
Profile in time of the experimental release of the fluorescent dye. (A) Percentage release of 5–(6) CF monitored in time up to 2.5 h for four different trials: two exposed samples using 2000 pulses and 2 Hz (dark and light blue) and two temperature control samples (dark and light green). (B) Spontaneous release of 5-(6) CF from liposomes due to the operative temperature of 37°C up to 2.5 h via spectrofluorimetry. A set of four different trails is reported (yellow, blue, red, magenta) with the calculated mean curve (green) and the standard deviation values as bars.

