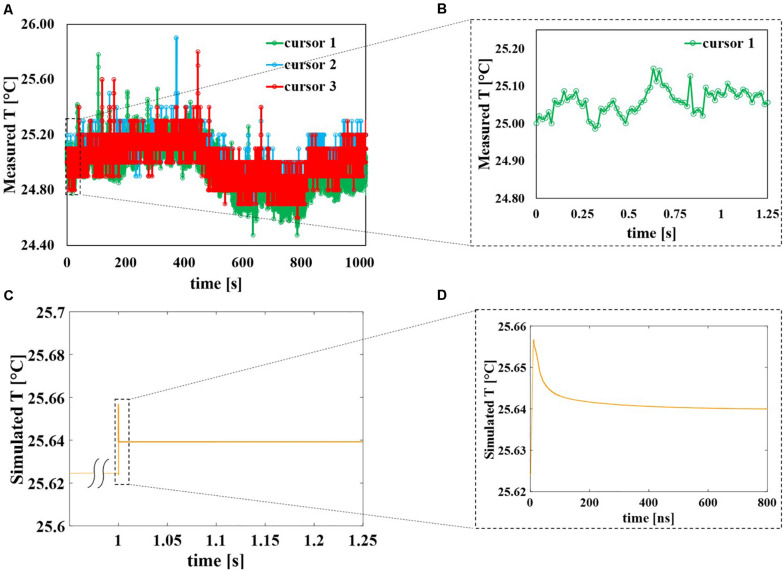
FIGURE 7.
Evolution in time of the sample temperature, comparison between experimental and numerical data. (A) Temperature of the solution sample experimentally measured using the thermal camera with a frame frequency of 16.3 Hz during the entire exposure of about 17 min. The peaks represent the times during which the pulses are delivered to the solution and are reported as isolated events. (B) Zoom of temperature experimentally measured with cursor #1 from the beginning of the exposure up to 1.25 s corresponding to the initial 40 pulses. (C) Simulated temperature of the sample when the 40th pulse is applied to the sample, considering the worst-case scenario. (D) Zoom of the simulated temperature data from t = 0 ns of the 40th pulse application up to 800 ns.

