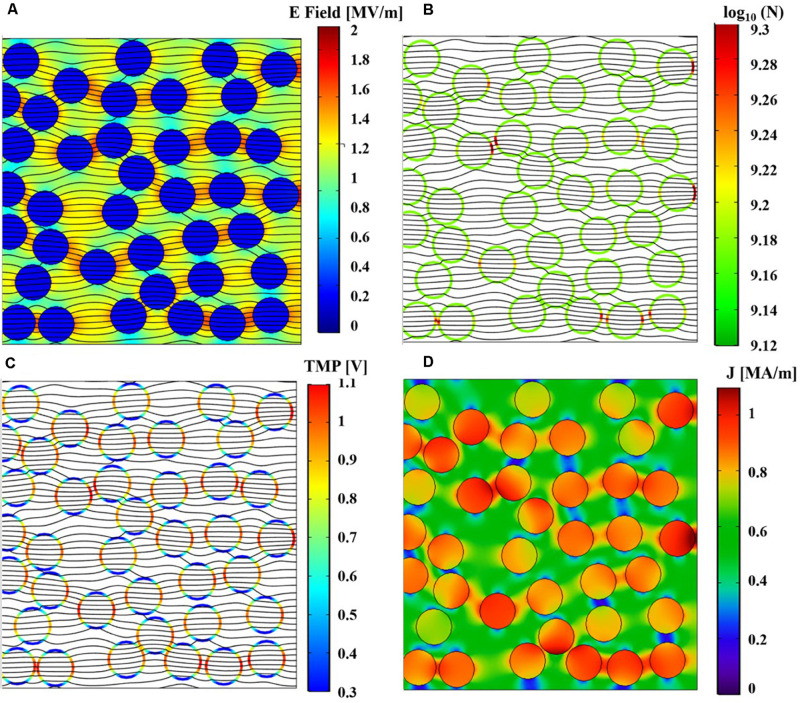
FIGURE 8.
Spatial distributions of the simulated physical quantities on a section of the simulation box at t = 10 ns of the 40th pulse application. (A) Simulated electric field distribution together with the current density streamlines. (B) Simulated pore density distribution on liposome membranes together with the current density streamlines. (C) Simulated TMP distribution on liposome membranes together with the current density streamlines. (D) Spatial distribution of the simulated density current norm.

