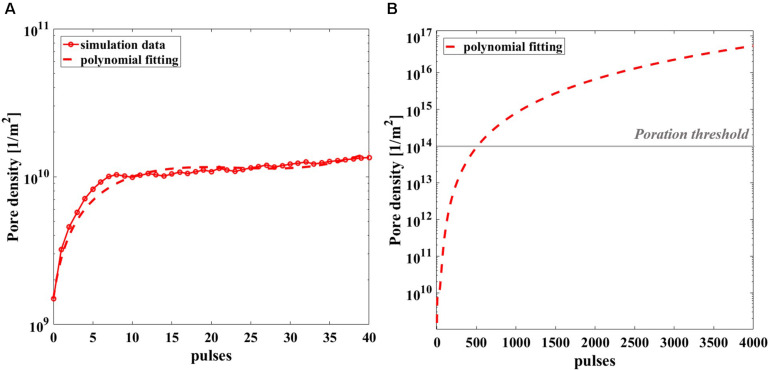
FIGURE 9.
Simulated pore density profile in time of the most exposed liposome of the model during the nsPEFs exposure. (A) The pore density curve obtained from the simulation (solid line with empty red circle as marker) is reported with the third-grade polynomial fitting curve (dashed line) up to 40 pulses, R2 = 0.9207. (B) Polynomial fitting curve of the pore density curve extrapolated up to 4000 pulses.

