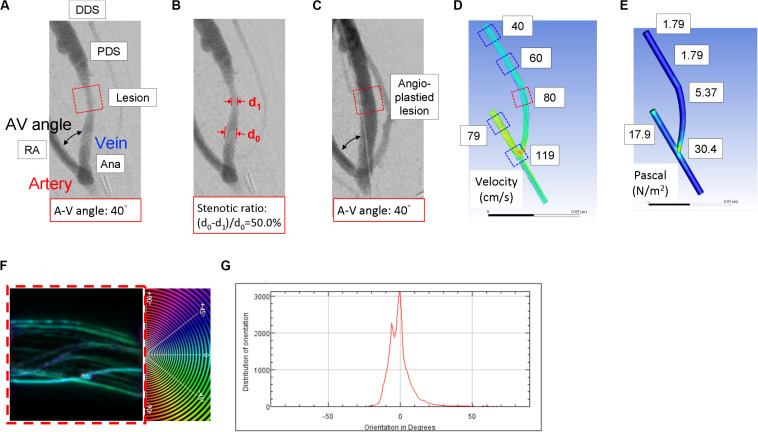
FIGURE 1.
The representative computational fluid dynamics simulation analysis of the blood flow characteristics in the patient-specific 3D-reconstructed arteriovenous fistula (AVF) model. (A) A representative angiographic AVF image of the hemodialysis patient before the angioplasty. (B) The radiocontrast presented on the angiographic image denotes the lumen of AVF. The percentage of stenosis was quantified by calculating the difference between the internal diameter of the upstream non-stenotic vascular segment (d0) and the internal diameter of the stenotic lesion site (d1). (C) A representative angiographic AVF image after angioplasty for the stenotic lesion. Various features, including blood flow velocity (D) and wall shear stress (E), were obtained at five different locations of the 3D geometric model mesh. The red square in the dotted line in (A) denotes the stenotic lesion site, one of the five locations of AVF. Numbers in white squares in (D,E) are the velocity and shear stress values for the five locations in (A). The stenotic region in (D) (red square in dotted line) was analyzed for vectors of blood flow trajectories (F) and the distribution plot of blood flow vectors (G). Zero-degree was set to be parallel with the axial direction of the blood vessel; the angle of deviation defined the blood flow vector, and the degree of the most abundant vectors was denoted as the blood flow disturbance. This was also performed for all the five locations of AVF. RA, radial artery; Ana, anastomosis; PDS, proximal downstream site; DDS, distal downstream site.

