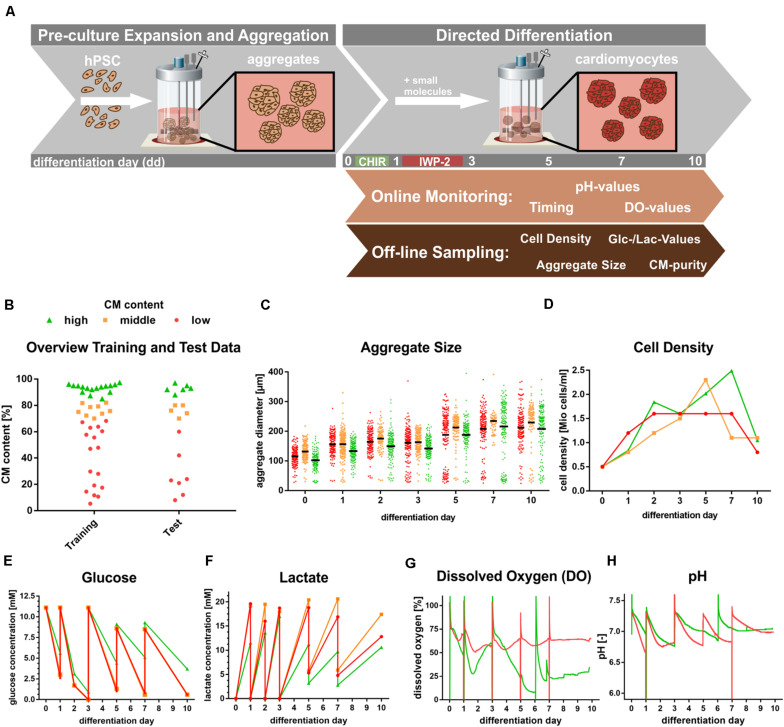
FIGURE 2.
Generation of experimental data. (A) Schematic bioreactor set-up of hPSCs expansion in suspension culture followed by directed cardiac differentiation by chemical WNT pathway modulation over 10 days. (B) Overview of Training and Test data spreads based on flow cytometry analysis of CM-specific MHC-expression. Definition: Endpoint analysis of processes resulting High ≥85% (green), middle 70–85% CM (orange) and low ≤70% CM content (red). (C–H) Representative patterns of process parameters, exemplifying processes typical for high (green), middle (orange), and low (red) CM content at process endpoint (day 10). (C) Aggregate size distribution at respective days of differentiation. (D) Representative cell density kinetics. (E,F) Glucose and lactate values over the course of differentiation. (G,H) Representative dissolved oxygen and pH patterns monitored via online analysis over the course of differentiation. Please note that the orange Glucose pattern in (E) is hardly visible due to the close overlay of the red pattern. In (G,H) only representative DO and pH patterns for respective high (green) and low (red) CM content processes are displayed to avoid loss of clarity by overlapping patterns.

