FIGURE 3.
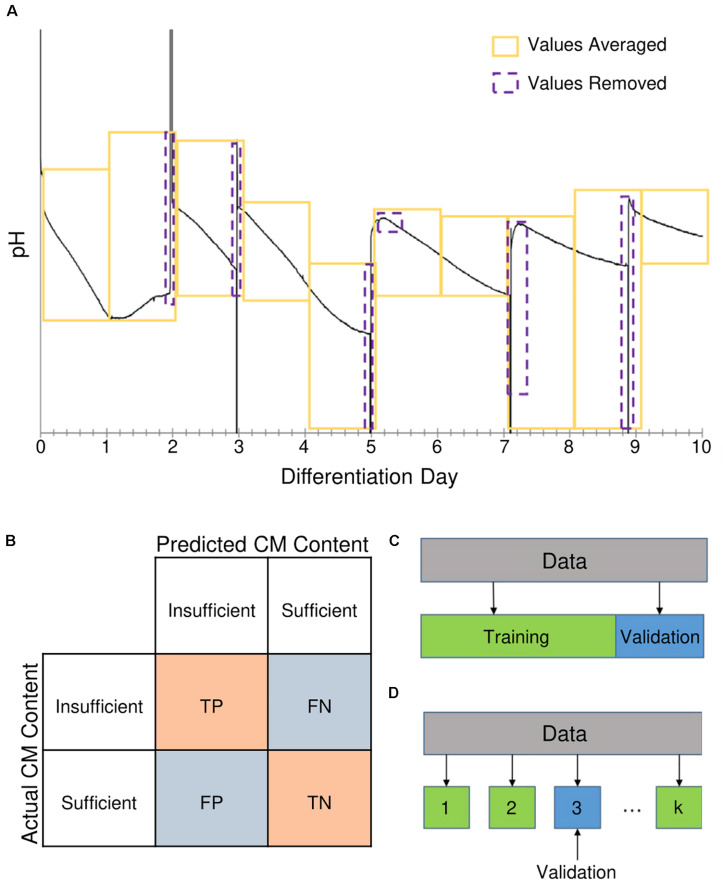
Methods used for generation of features and evaluation of model performance. (A) Continuous measurements for pH and dissolved oxygen (DO) concentration were averaged by differentiation day. Yellow boxes represent time periods measurements were averaged over (i.e., differentiation days). Purple boxes represent measurements taken during media changes that were removed from the averaging. (B) Model performance was evaluated based on metrics from the classification confusion matrix. When the model correctly identified the result as “insufficient” or “sufficient,” it was labeled as a true positive (TP) or true negative (TN) result, respectively. A “sufficient” result incorrectly identified as “insufficient” was considered a false positive (FP), whereas an “insufficient” result incorrectly identified as “sufficient” was a false negative (FN). (C) During model training, the performance was validated using leave one out (LOO) cross-validation and Monte Carlo (MC) cross-validation. In LOO cross-validation, a single data point was set aside while the model was built with the remaining data points; a prediction is then obtained for the data point that was left out. This process was repeated for each data point, resulting in a prediction for each data point that were used in calculating performance metrics. (D) For MC cross-validation, a set of data was randomly selected to be excluded for validation, and the model was built using the remaining data.

