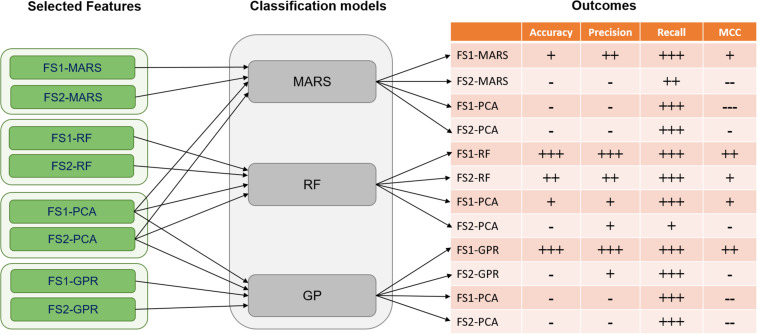
FIGURE 5.
Classification results were based on four metrics including accuracy, precision, recall, and MCC (Matthews correlation coefficient) for selected features of FS1 and FS2. The classification models of MARS (Multi-adaptive regression splines), RF (Random Forest), and GPR (Gaussian process regression) were implemented. For accuracy, precision, and recall the values are categorized as follows: (—) for values < 0.3, (–) for 0.3 ≤ values < 0.6, (-) for 0.6 ≤ values < 0.7, (+) for 0.7 ≤ values < 0.8, (++) for 0.8 ≤ values < 0.9, and (+++) for value ≥ 0.9. Moreover, for the MCC metric, the categorization was done as: (—) for values < 0, (–) for 0 ≤ values < 0.1, (-) for 0.1 ≤ values < 0.3, (+) for 0.3 ≤ values < 0.7, (++) for 0.7 ≤ values < 0.9, and (+++) for value ≥ 0.9.

