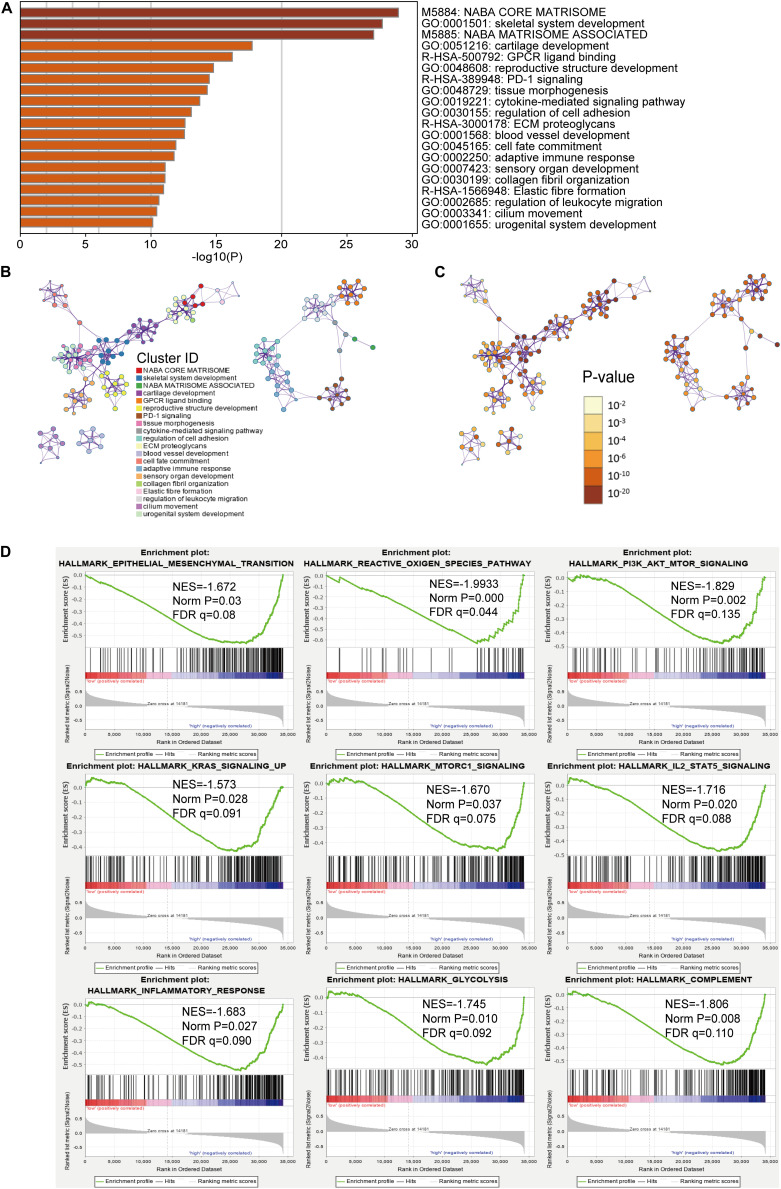
FIGURE 5.
Functional analysis of 2571 differentially expressed genes (DEGs) between the low- and high-risk subgroups. (A) Heatmap of enriched terms across the inputted gene list, colored according to p-value. Network of enriched terms colored according to (B) cluster ID (nodes with the same cluster ID are typically close to each other) and (C) p-value (terms with more genes tend to have higher p-values). (D) Gene set enrichment analysis (GSEA) indicating that tumor hallmarks were enriched in the high-risk subgroup.

