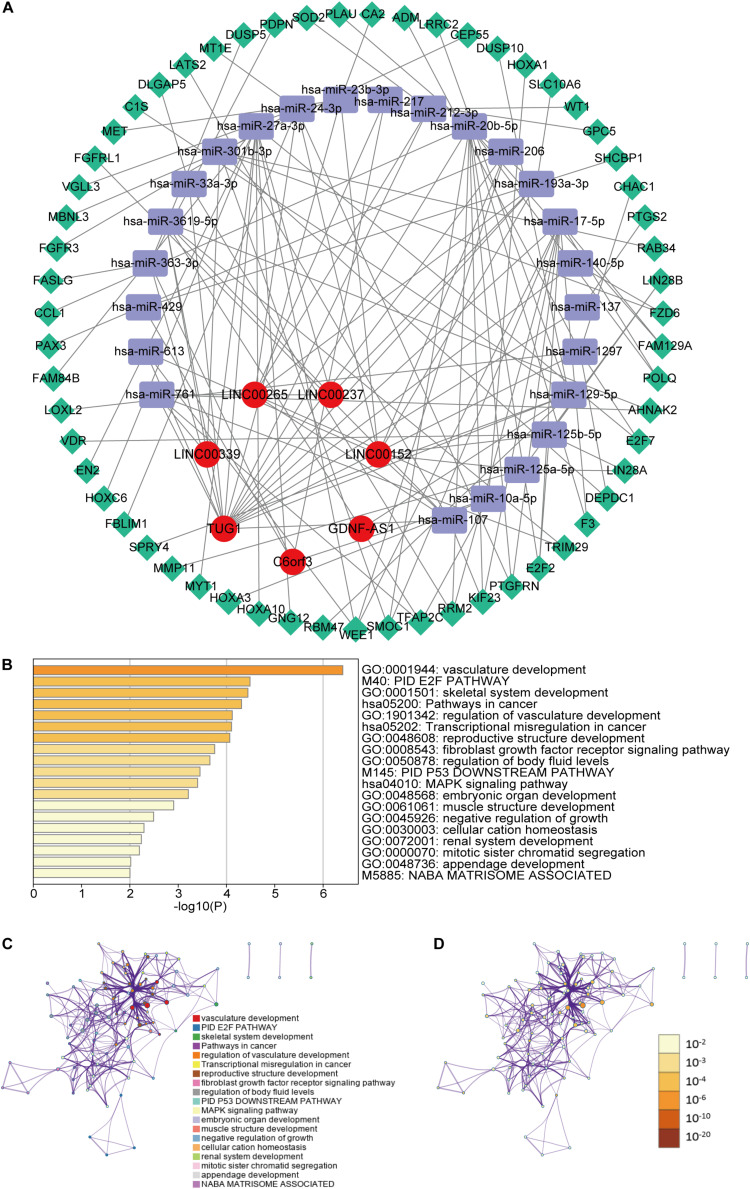
FIGURE 7.
(A) The ceRNA network of the seven m6A-related lncRNAs (red) and their target miRNAs (blue) and mRNAs (green). (B) Heatmap of enriched terms across the fifty-nine mRNAs, colored according to p-value. Network of enriched terms colored according to (C) cluster ID (nodes with the same cluster ID are typically close to each other) and (D) p-value (terms with more genes tend to have higher p-values).

