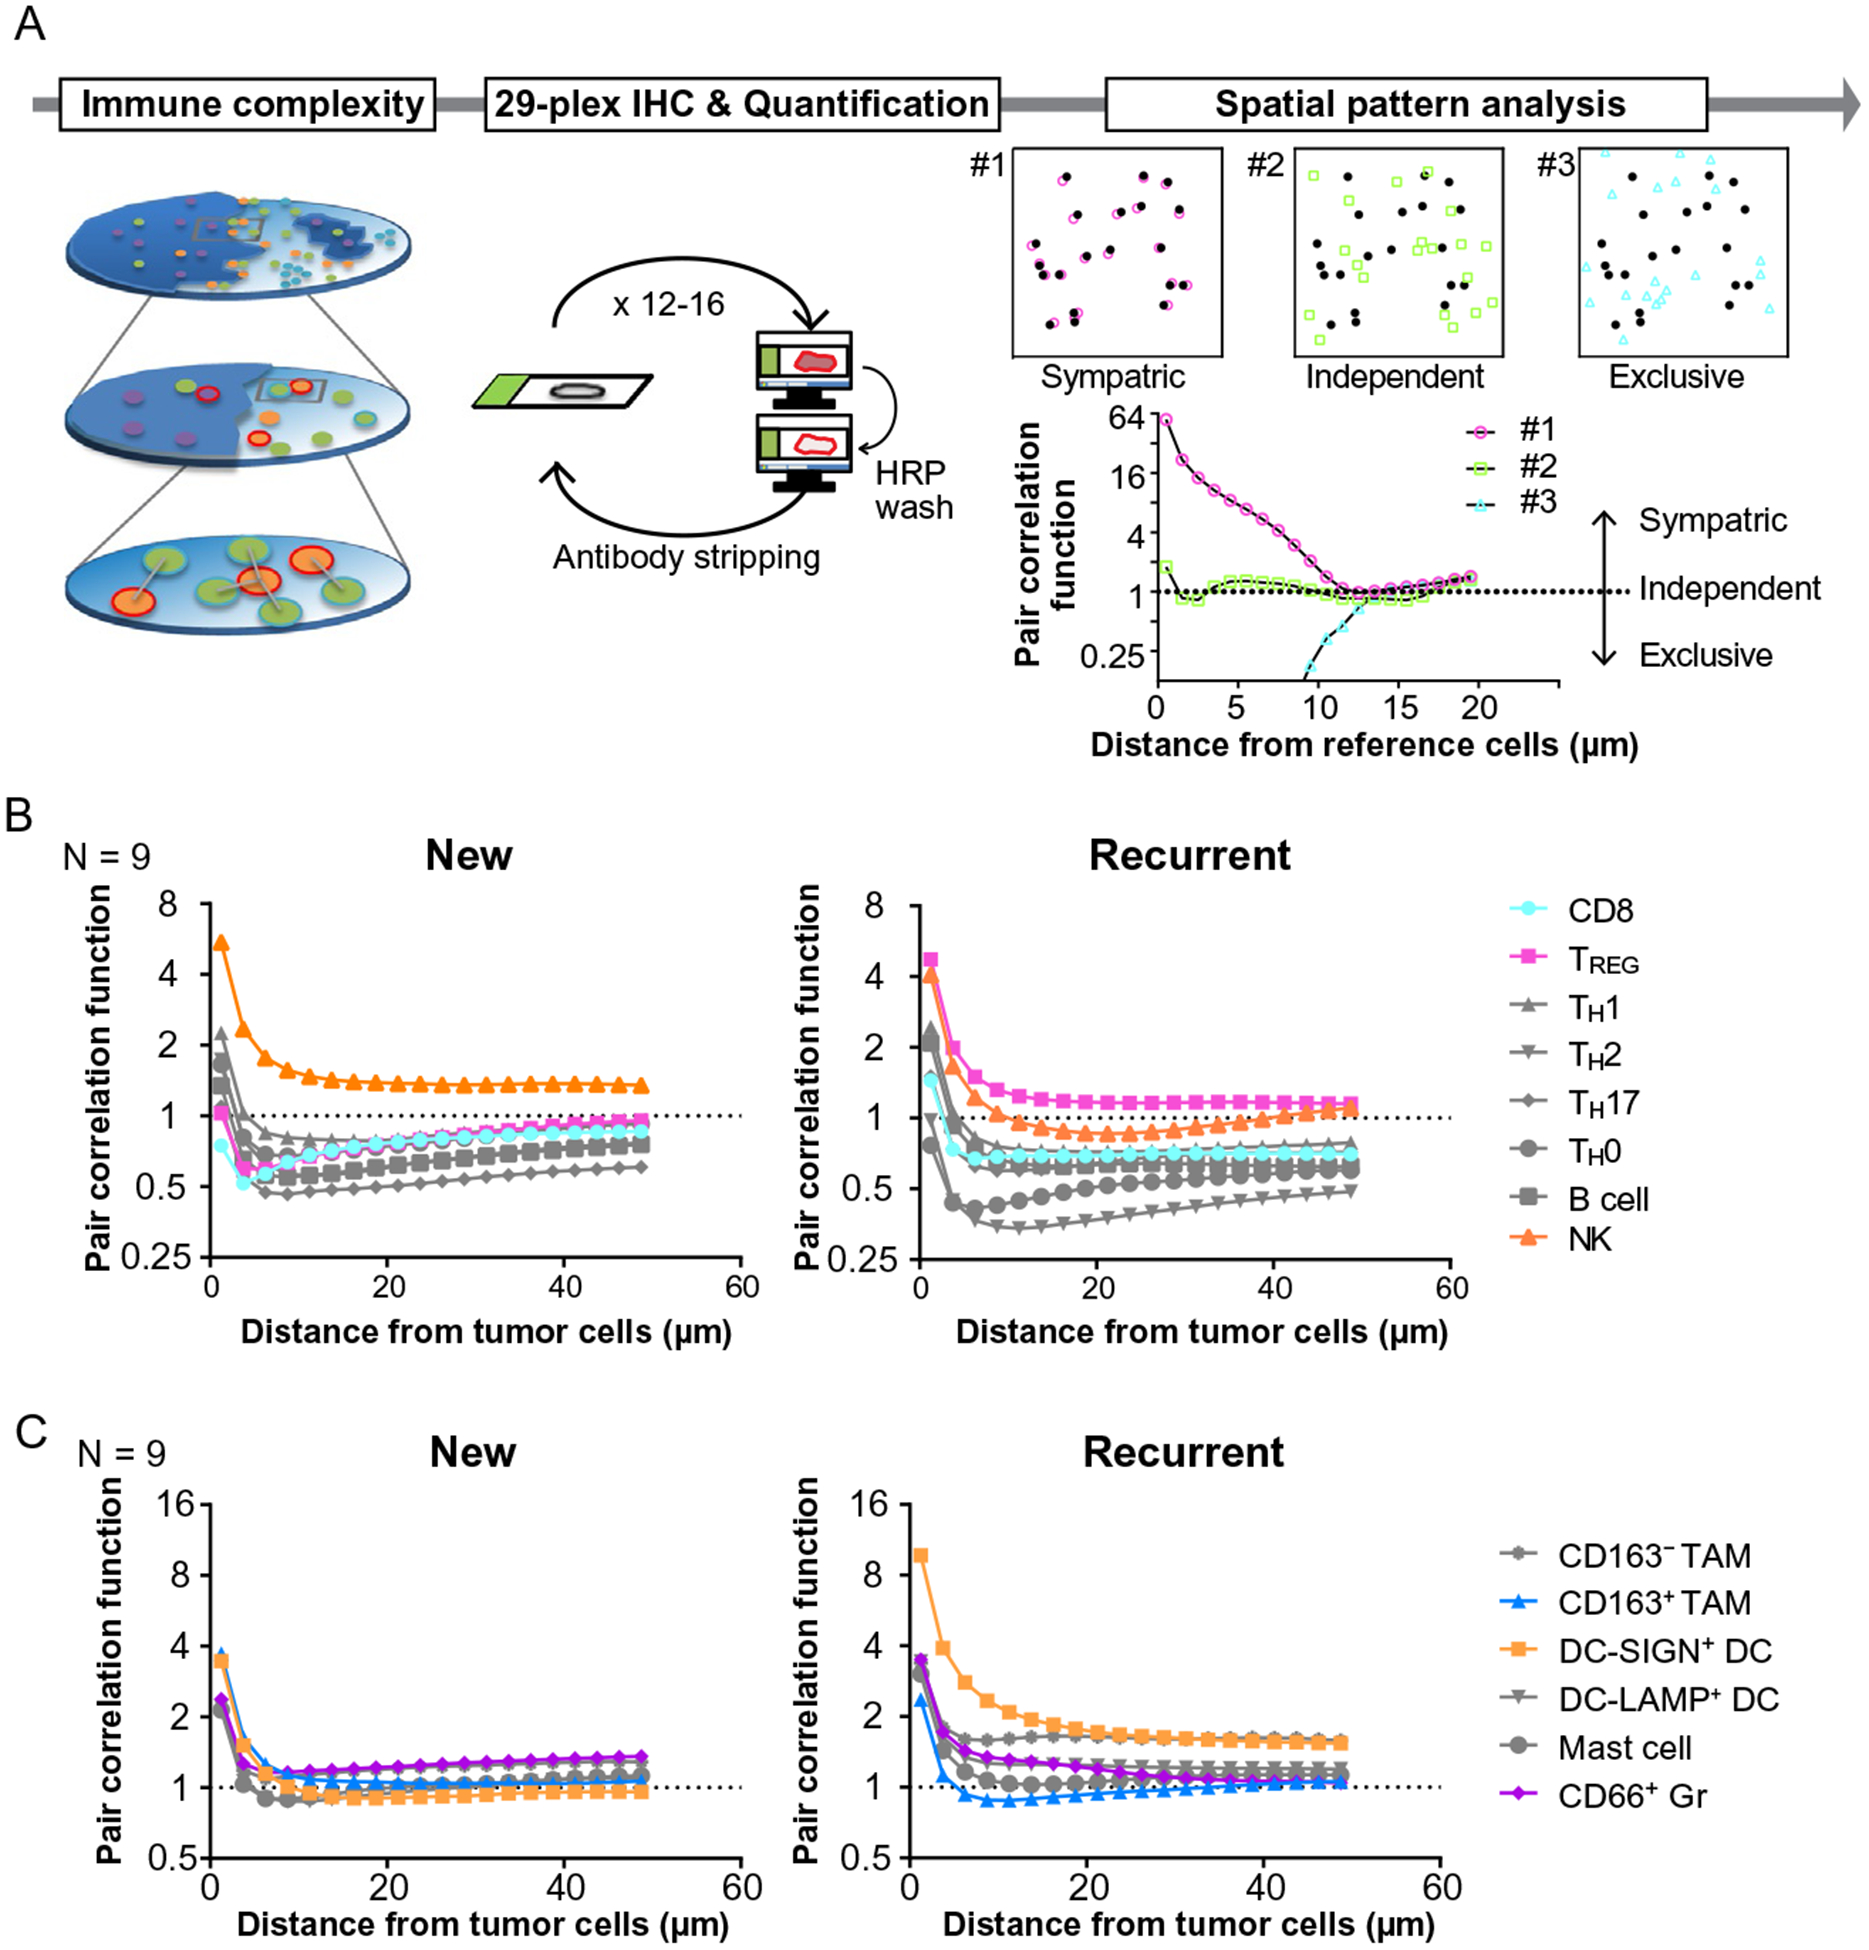
Fig. 6.

Comparative analysis of primary and recurrent HNSCC reveals the dynamics of immunospatial profiles. (A) A schematic overview of immunospatial complexity analysis based on 29-plex IHC is shown. Spatial pattern analysis performed based on calculation of pair correlation function, which represents the probability of finding an object at a distance away from a reference cell, independent of cell density of object cell lineages. Three examples demonstrate representative patterns of spatial distribution as the value of one stands for independent distribution. (B, C) Averages of pair correlation function based on distance from tumor cells are shown (N=9) in lymphoid (B) and myeloid lineages (C).
