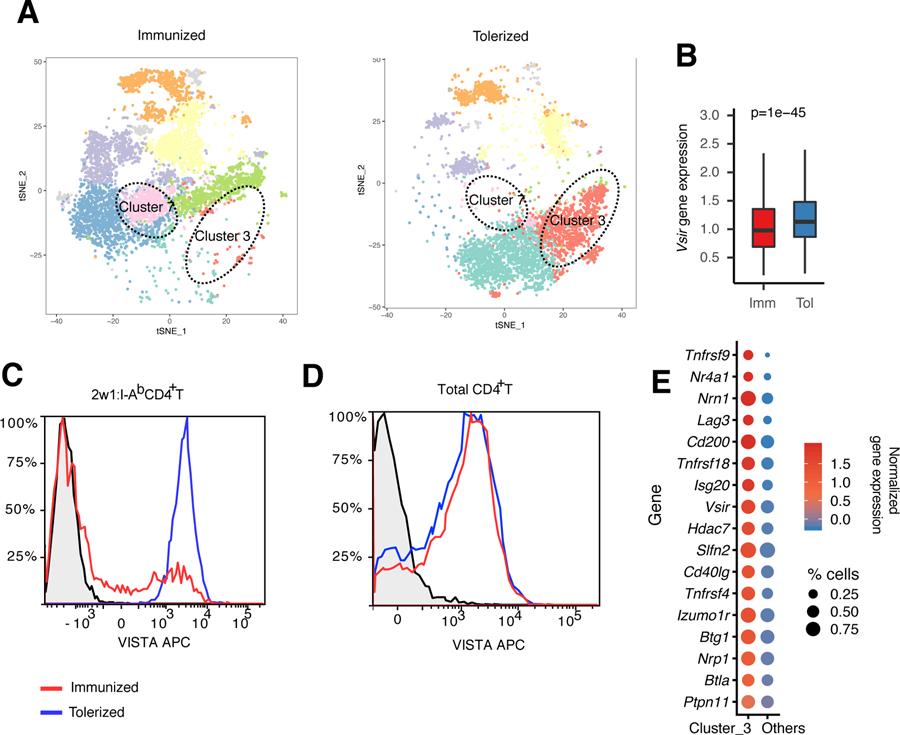
Fig. 3. VISTA expression is reduced under inflammatory, but not tolerogenic, conditions in vivo.
To provide a model of antigen-specific stimulation for the antigen-specific CD4+ T cell repertoire studies in Fig. 2, C57BL/6 mice were either immunized using 2w1s peptide with LPS or tolerized using 2w1s peptide only. Then, the phenotype of 2w1s:I-Ab–specific CD4+ T cells was analyzed using scRNA-seq and flow cytometry. (A) The t-SNE plot shows the cluster distribution of 2w1:I-Ab peptide–induced CD4+ T cells from immunized (2w1s peptide with LPS) and tolerized (2w1s peptide) mice. Each dot corresponds to one single cell, colored according to cell cluster. The dashed circles indicate the anergic T cell cluster (cluster 3) and T follicular helper T cell cluster (cluster 7). (B) Boxplot depicting the difference in Vsir gene, which encodes VISTA, expression between immunized and tolerized CD4+ T cells across all clusters. The center line refers to the median value for Vsir gene expression. The whisker indicates the 25th to the 75th percentile of Vsir gene, which encodes VISTA, expression. P values were calculated by Wilcoxon rank sum test. (C and D) Flow cytometric analysis of 2w1s:I-Ab–specific CD4+ T cells (C) or total CD4+ T cells (D) under the same tolerization versus immunization conditions presented in (A). The black plot line and shaded region indicate staining of VISTA knockout CD4+ T cells as a biological control. APC, allophycocyanin. (E) Bubble plot showing the average Z-transformed normalized expression of coinhibitory module genes in cluster 3 versus other clusters. The size of each bubble indicates the fraction of cells expressing the represented gene. Data are representative of two independent experiments with at least three mice per group [(A) to (E)].

