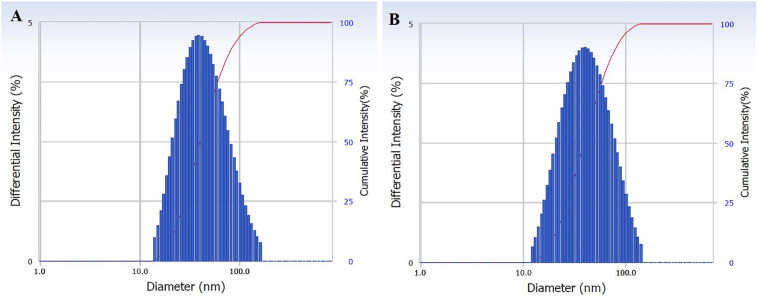
FIGURE 1.
Characterization of isolated exosomes with both methods (A) UC and (B) TEIp by size distribution of their hydrodynamic diameter using Delsa Nano Analyzer (DelsaNano, Beckman Coulter, Brea, CA, United States). The histograms display the intensity (weighted) size distributions, and the scale of each peak is proportional to the percentage (% amount of the total scattered intensity due to exosome particles).

