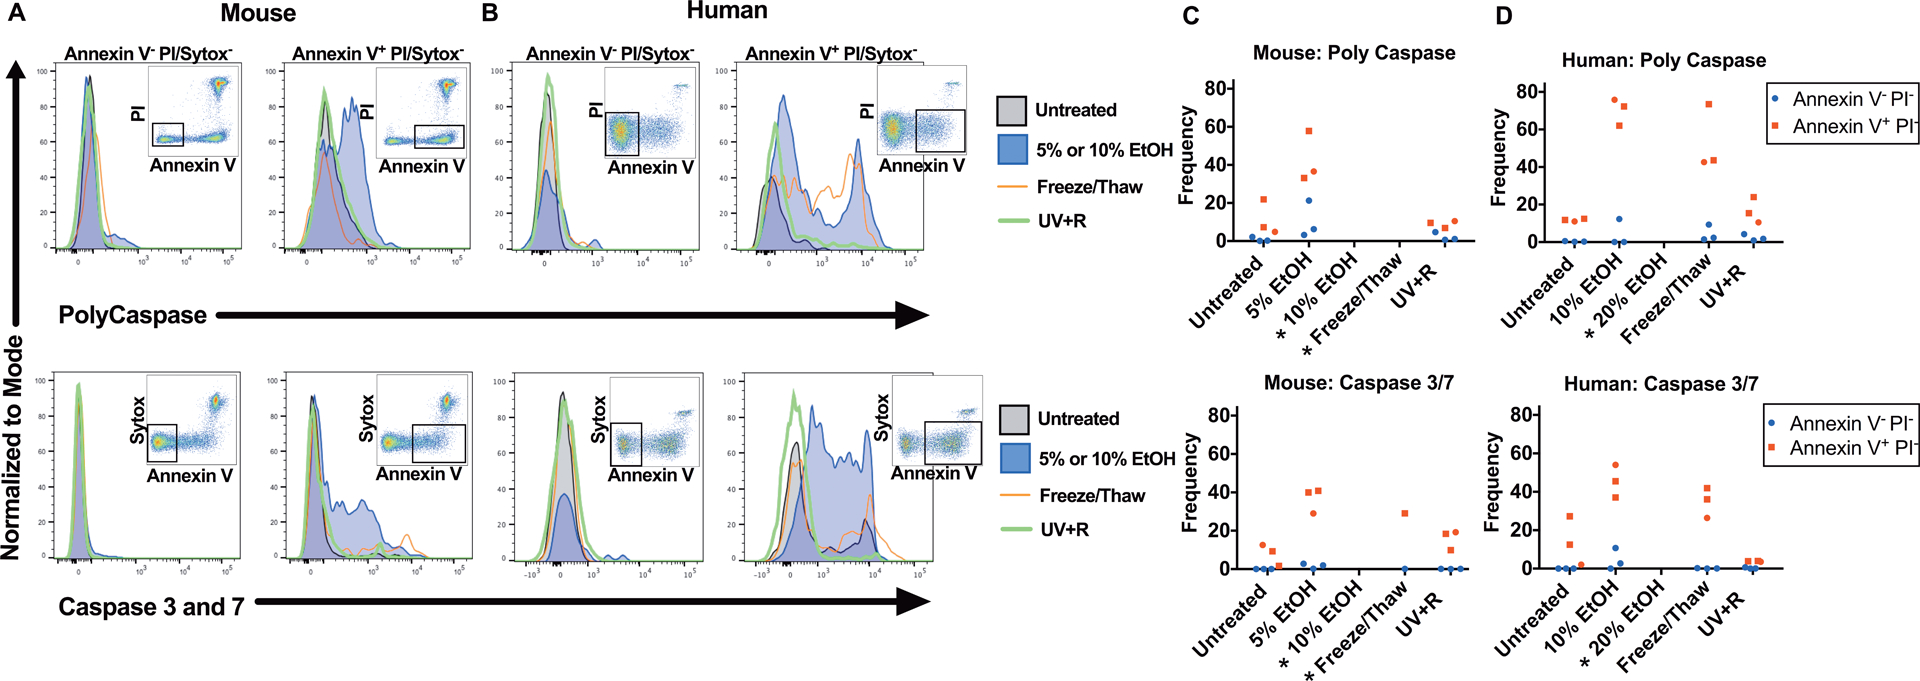
Figure 3: Little to no caspase activity is detected after UV+R treatment.

Total caspase (top panel) and effector caspase 3 and caspase 7 (bottom panel) activity were measured in WBCs from (A) B6 mice or (B) healthy human donors. WBCs were untreated, or treated with 5% EtOH, 10% EtOH, a freeze/thaw cycle or pathogen reduction with UV+R. Samples were analyzed within 4–5 hours of UV+R treatment. Gating by flow cytometry selected for single lymphocytes (CD14− for human samples) and for Annexin V− PI/Sytox AADvanced− or Annexin V+ PI/Sytox AADvanced−, respectively. Live/dead markers used were PI or Sytox AADvanced dead cell stain kit. Representative flow cytometry plots are from the UV+R treated group of each respective experiment and highlight the population selected for the histogram. Graphical representation of compiled data from three independent experiments in (C) mice and (D) humans (N=3). (*) Data below 200 events not shown.
