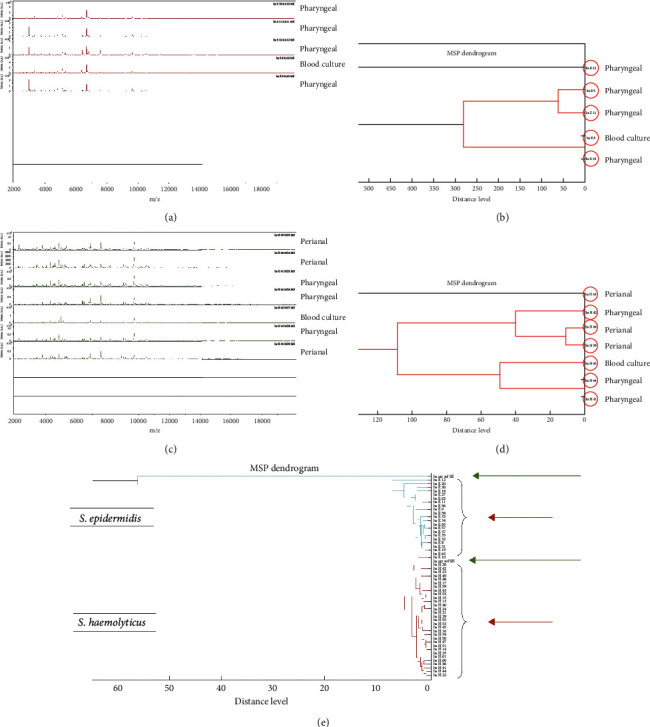
Figure 3.

MALDI-TOF MS analysis (a) and representative dendrogram (b) of S. epidermidis strains isolated from a positive blood culture and 4 pharyngeal samples in a symptomatic neonate (n = 1). MALDI-TOF MS analysis (c) and representative dendrogram (d) of S. haemolyticus strains isolated from a positive blood culture, 3 pharyngeal samples, and 3 perianal samples in a symptomatic neonate (n = 1). Note the similarity in the graphs and dendrograms comparing pharyngeal, perianal, and blood culture strains (a–d). Main spectra dendrogram (e) of mass spectrum profiles of 23 S. epidermidis and 31 S. haemolyticus strains isolated from positive blood cultures, pharyngeal samples, and perianal samples from symptomatic neonates (short red arrows) was compared to 1 S. epidermidis and 1 S. haemolyticus strain from healthy neonates (long green arrows). In (a) and (c), the x-axis depicts the mass-to-charge ratio in m/z, while the y-axis depicts the intensity of the spectra in arbitrary units (a.u.).
