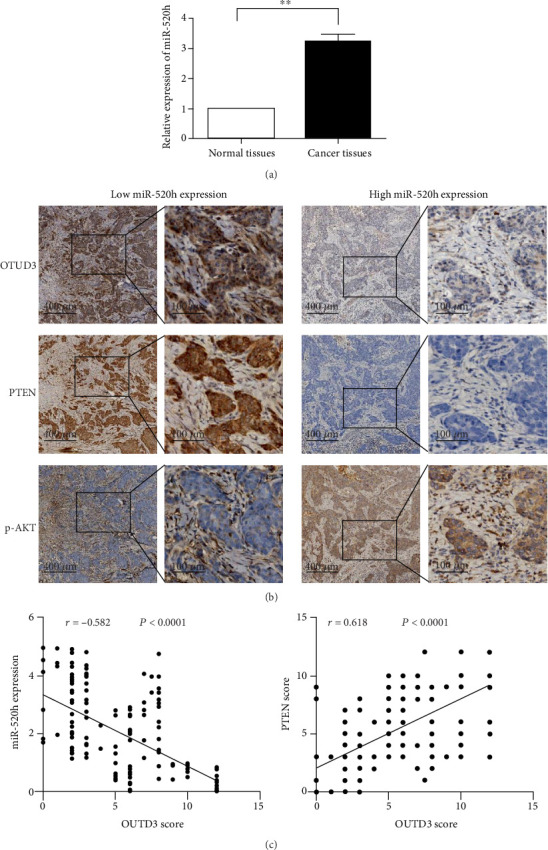
Figure 4.

miR-520h, OTUD3, PTEN, and p-AKT expression in breast cancer tissues. (a) Relative expression of miR-520h in normal breast vs. breast cancer tissues. (b) The expression of OTUD3, PTEN, and p-AKT in breast cancer tissues of different miR-520h levels. (c) Correlation analysis of the expression of OTUD3 with miR-520h and PTEN. ∗P < 0.05.
