
Figure 4.
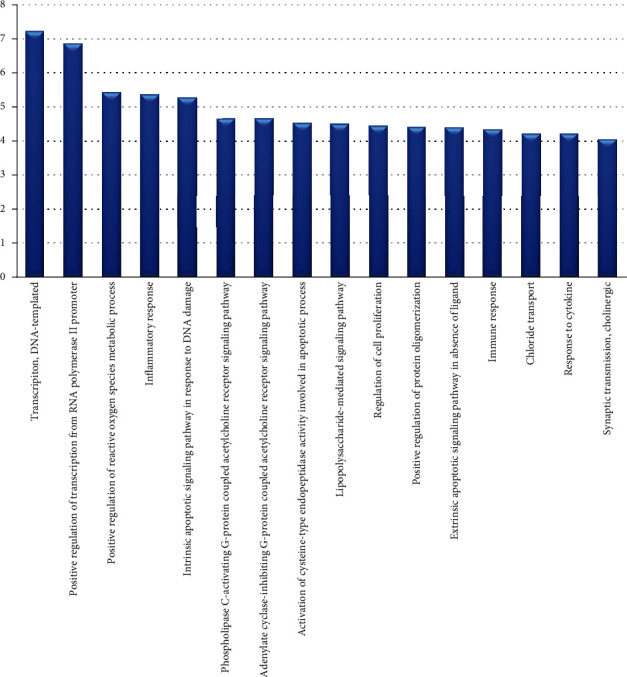
Gene Ontology (GO) analysis of target genes for treatment. The y-axis shows a significantly rich “biological process” category in the GO of the target gene, and the x-axis shows the enrichment score of these terms.
Official websites use .gov
A
.gov website belongs to an official
government organization in the United States.
Secure .gov websites use HTTPS
A lock (
) or https:// means you've safely
connected to the .gov website. Share sensitive
information only on official, secure websites.
Gene Ontology (GO) analysis of target genes for treatment. The y-axis shows a significantly rich “biological process” category in the GO of the target gene, and the x-axis shows the enrichment score of these terms.