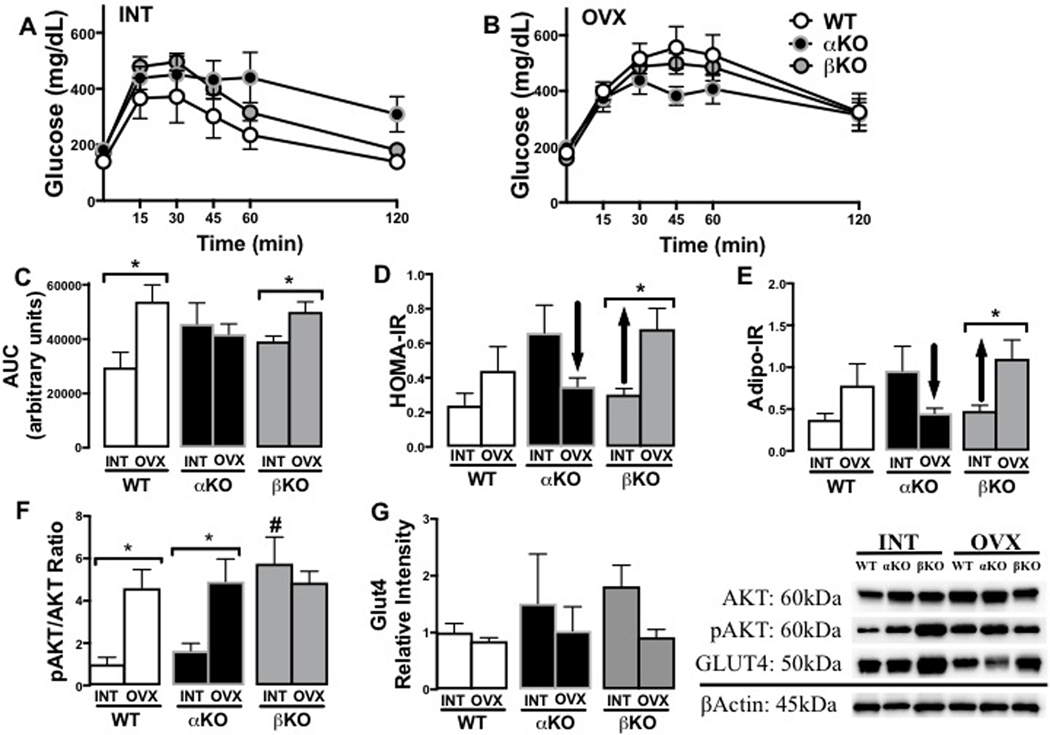
Figure 5. Genotype-specific changes in indicators of insulin resistance following ovariectomy.
(A) Glucose tolerance test (GTT) curves of ovary-intact (INT) mice; (B) GTT curves of ovariectomized (OVX) mice; (C) GTT area under the curve (AUC) in INT versus OVX mice; (D) Homeostatic assessment of insulin resistance (HOMA-IR) in INT and OVX mice; (E) Adipocyte insulin resistance (Adipo-IR) in INT and OVX mice; (F) White adipose tissue (WAT) (from subcutaneous depot) pAkt/Akt ratio protein levels in INT and OVX mice; and (G) WAT (from subcutaneous depot) GLUT4 protein levels in INT and OVX mice (representative blot images shown to the right). Ovary-intact (INT); ovariectomized (OVX); wildtype (WT); estrogen receptor alpha knockout (αKO); estrogen receptor beta knockout (βKO). * p<0.05 compared to INT within genotype; # p<0.05 compared to other genotypes within INT state. Values are expressed as mean ± SEM.

