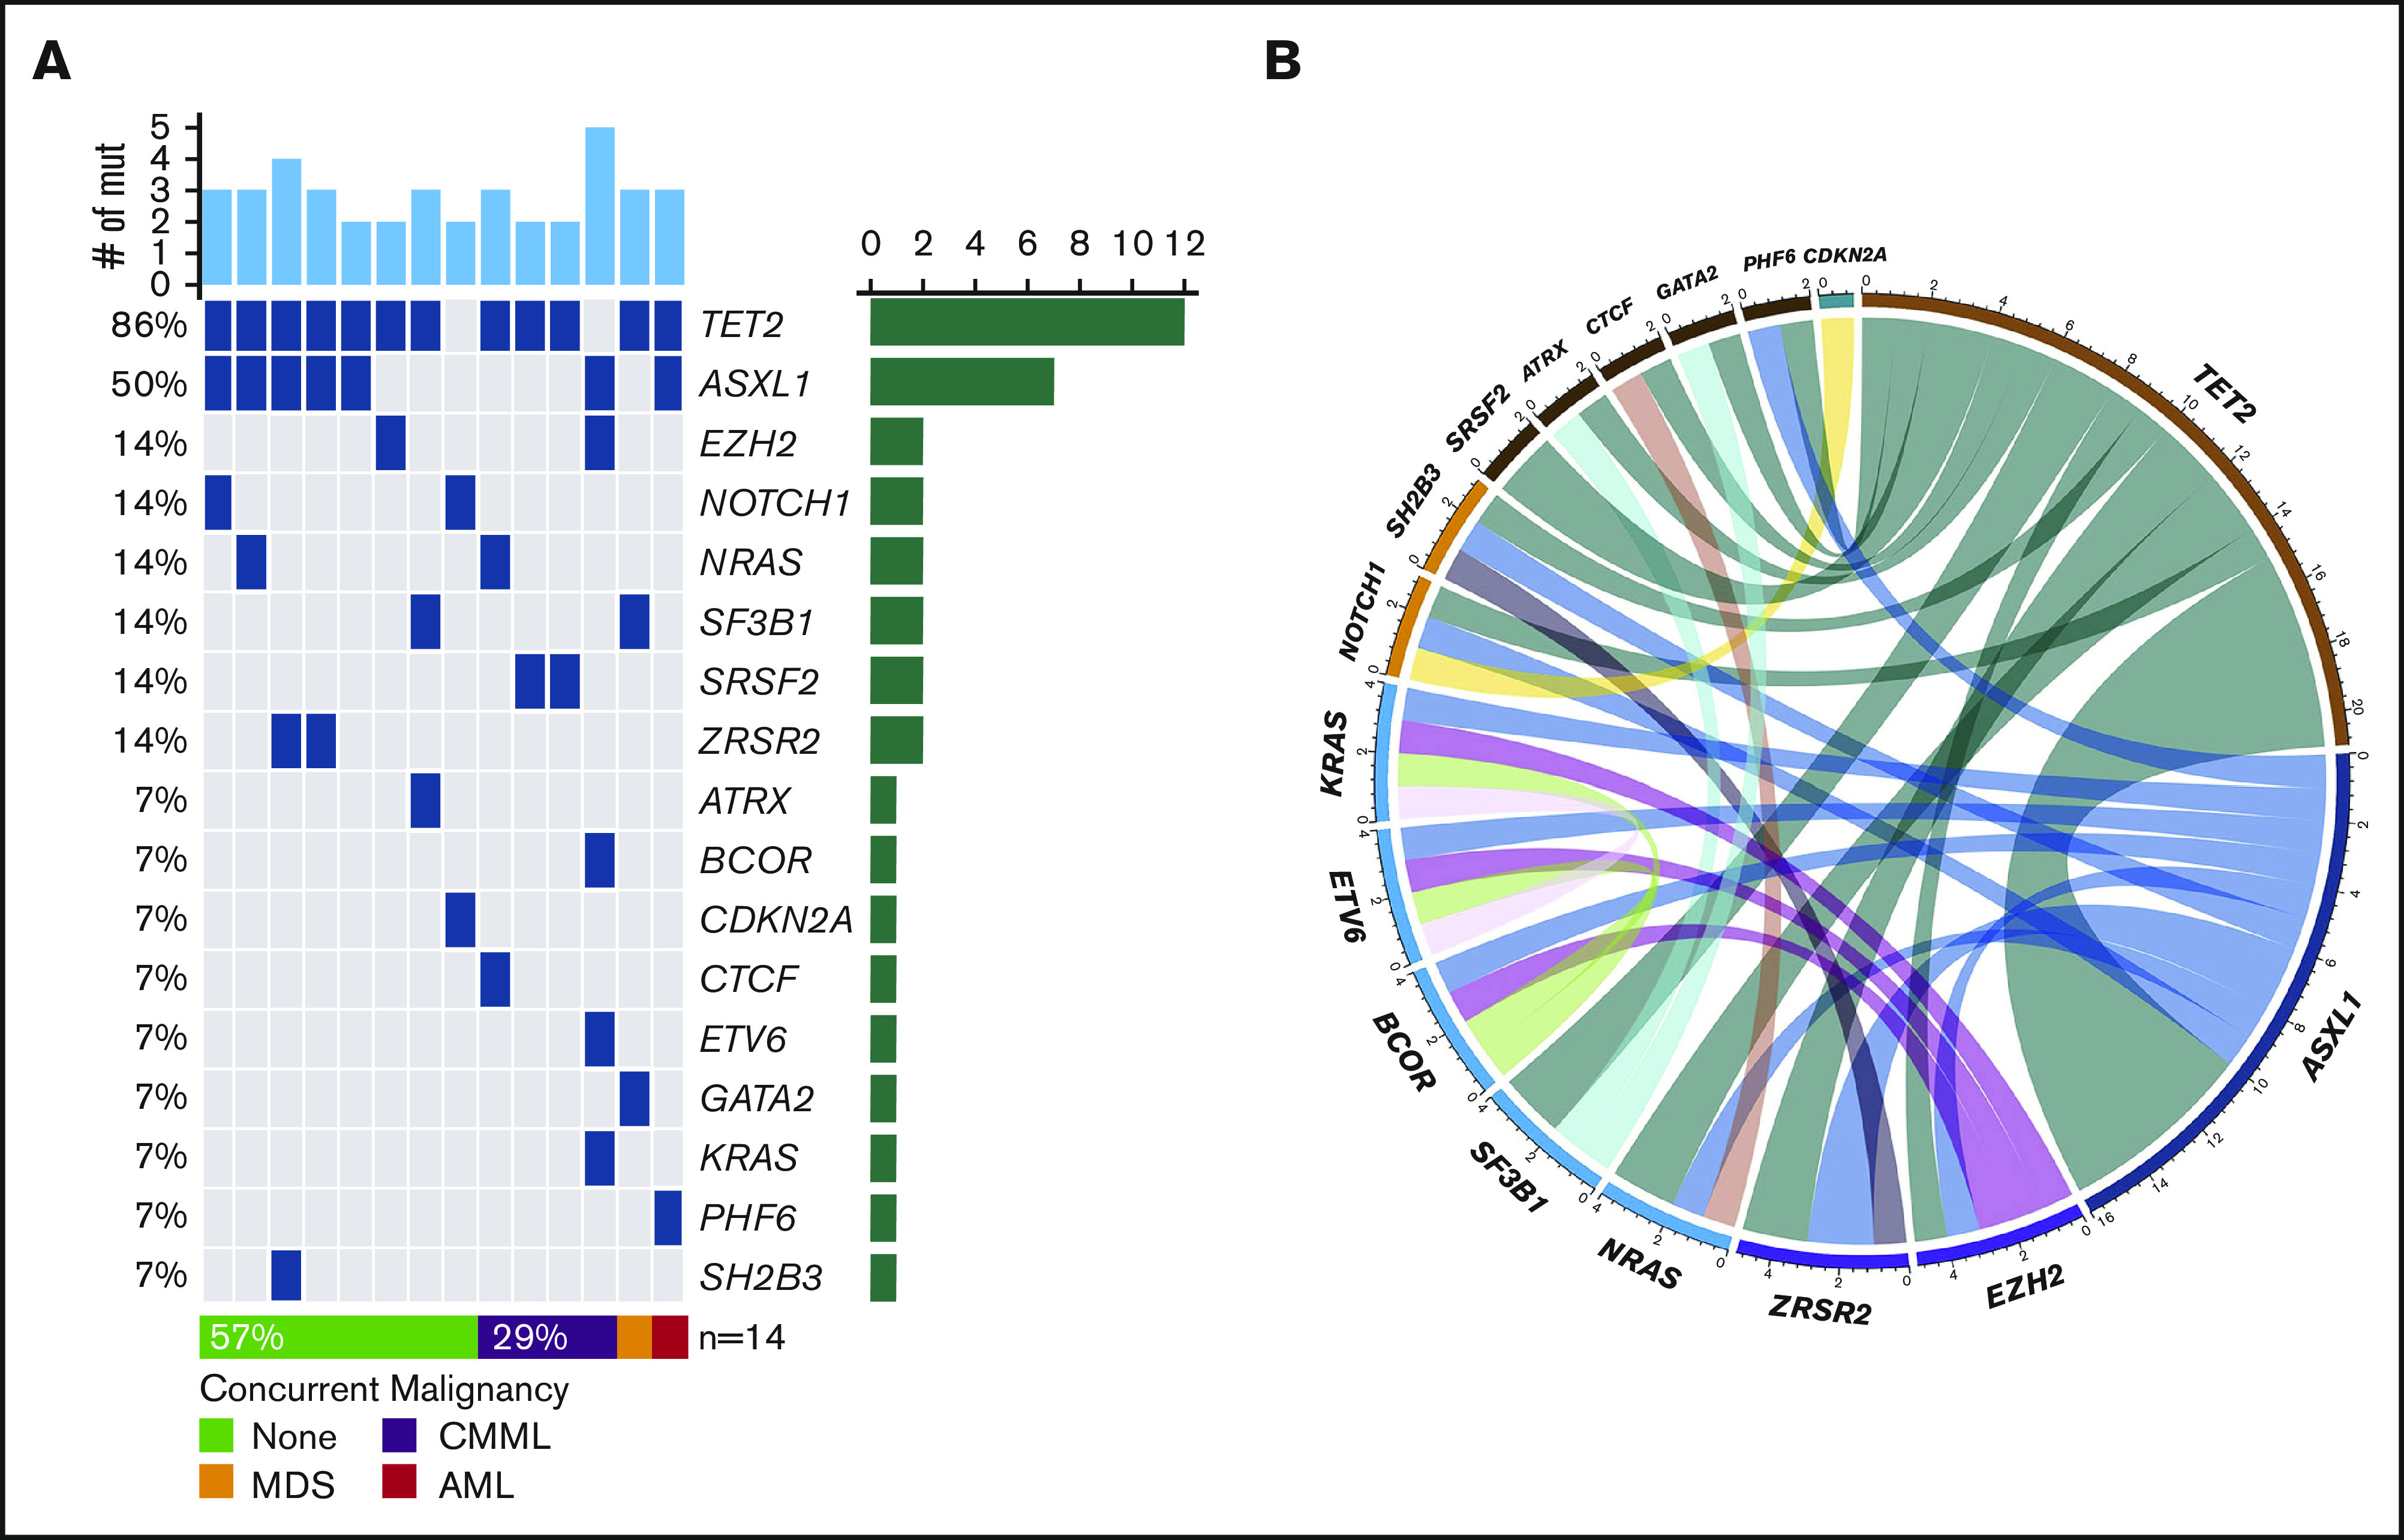
Figure 1.

Landscape of somatic mutations and cytogenetics. (A) Mutated genes in BPDCN patients (n = 14). Each column represents individual patient and somatic mutations are highlighted in blue in each gene (rows). Top bar plot indicates number of somatic mutations in individual patient and side bar plot indicates the number of patients who are positive for individual somatic mutation. Bottom bar represents concurrent hematologic malignancy. (B) Comutations between genes in patients with BPDCN (n = 14).
