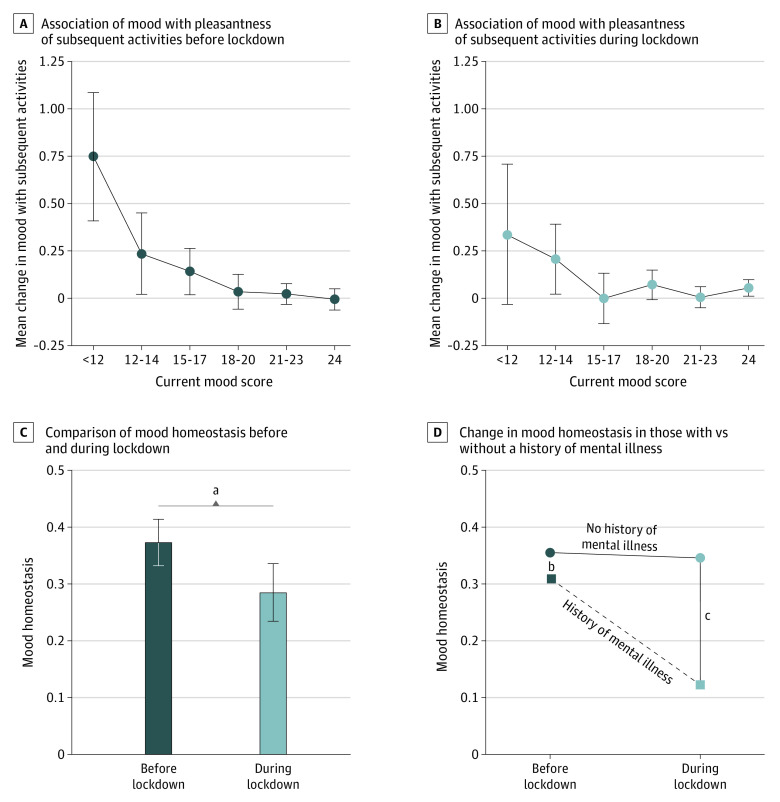
Figure. Mood Homeostasis Before and During Lockdown.
Association between mood at one time point and the pleasantness of the activities at the next time point (ie, how much participants engaged in activities that tended to increase their mood at the next time point) before (A) and during (B) the lockdown due to coronavirus disease 2019. C, Mood homeostasis was significantly lower during compared with before the lockdown. D, The change in mood homeostasis was significantly larger among participants with a history of mental illness compared with those without. Mood scores were collected using ecological momentary assessment 4 times every day over 14 days. Error bars indicate 95% CIs.
aP = .003.
bP = .37.
cP < .001.

