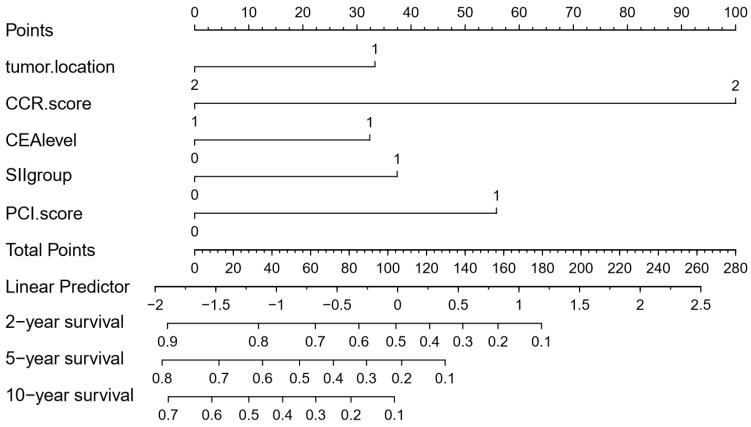
Figure 3.
Nomogram of predicting 2-, 5- and 10-year survival for SCRPC patients after CRS and systematic CT. Tumor location: 1, right semicolon; 2, left semicolon; CCR score: 1, CCR0/1; 2, CCR2/3; CEA level: 0, ≦5ng/ml; 1, >5ng/ml; SII group: 0, SII<410; 1, SII≥410; PM level: 0, limited; 1, extended.

