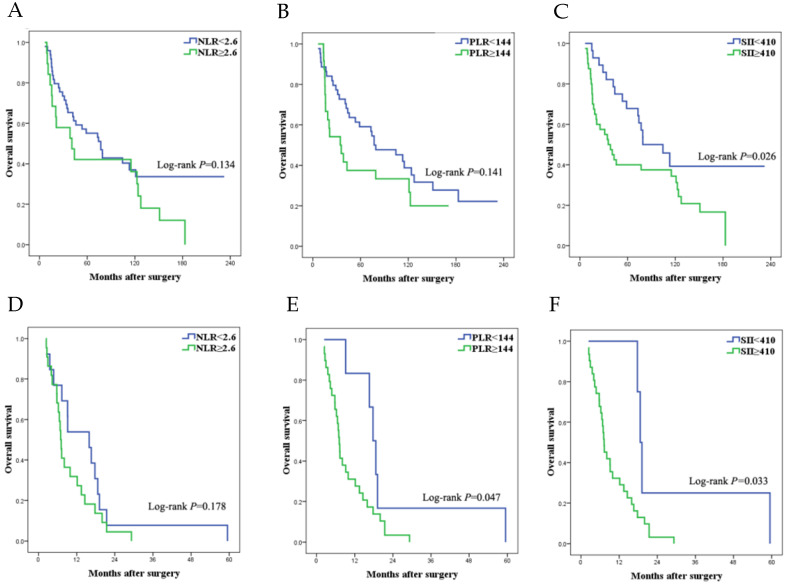
Figure 4.
Survival curves of SCRPC patients following different levels of CRS. (a-c) SCRPC patients following CCR 0/1 surgery. a. high vs low NLR group; b. high vs low PLR group; c. high vs low SII group. (d-f) SCRPC patients following CCR 2/3 surgery. d. high vs low NLR group; e high vs low PLR group; f. high vs low SII group.

