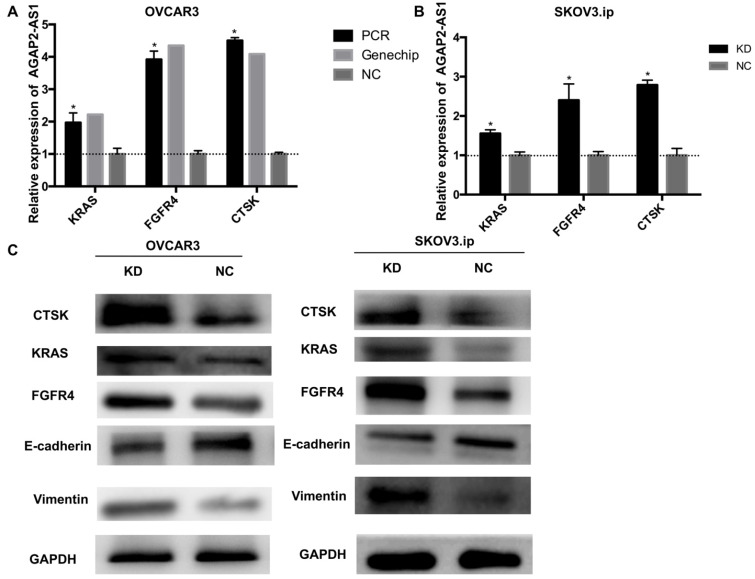
Figure 6.
AGAP2-AS1 knockdown regulated KRAS, CTSK, and FGFR4 expression in SKOV3.ip and OVCAR3 cells and induced epithelial-mesenchymal transition. (A) KRAS, FGFR4, and CTSK were significantly upregulated in SKOV3.ip and OVCAR3 cells after AGAP2-AS1 silencing, which was consistent with the PCR array results. (B) The protein levels of KRAS, FGFR4, and CTSK were detected by Western blotting after AGAP2-AS1 knockdown. After AGAP2-AS1 knockdown, E-cadherin levels were reduced, and vimentin levels were increased. All results are shown as the mean ± SD and are representative of three independent experiments. (*P < 0.05, Student's t-test).

