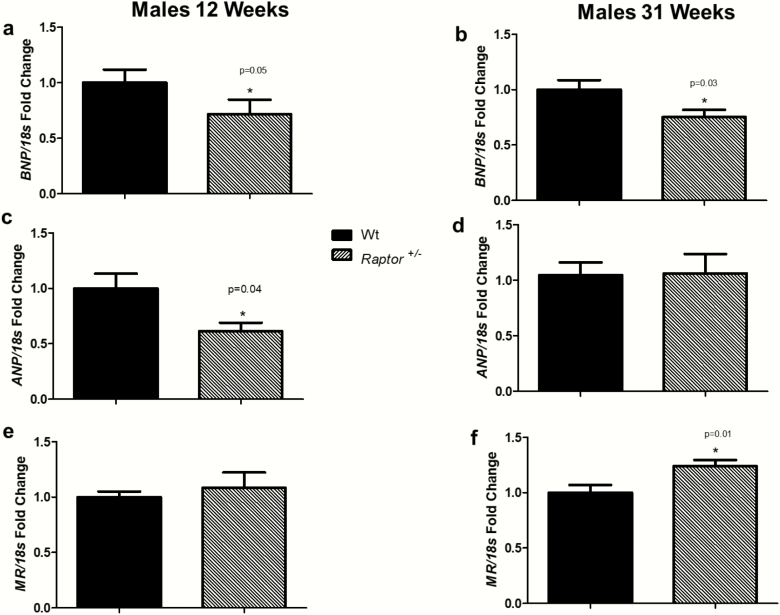
Figure 6.
RT-PCR analysis of cardiac BNP, ANP, and MR expression in response to LibS in Wt and Raptor +/- male mice. *Levels in Wt mice were significantly different (P < 0.05) from corresponding levels in Raptor +/- mice: expression of BNP at 12 weeks old (n = 7–9 per group) (A) and at 31 weeks old (n = 9 per group) (B); expression of ANP at 12 weeks old (n = 7–9 per group) (C) and at 31 weeks old (n = 9 per group) (D); expression of MR at 12 weeks old (n = 7–9 per group) (E) and at 31 weeks old (n = 9 per group) (F). Data represent means ± SEM, and relative to 18S rRNA. Student t-test for unpaired data was used to compare groups.

